Environmental Engineering Reference
In-Depth Information
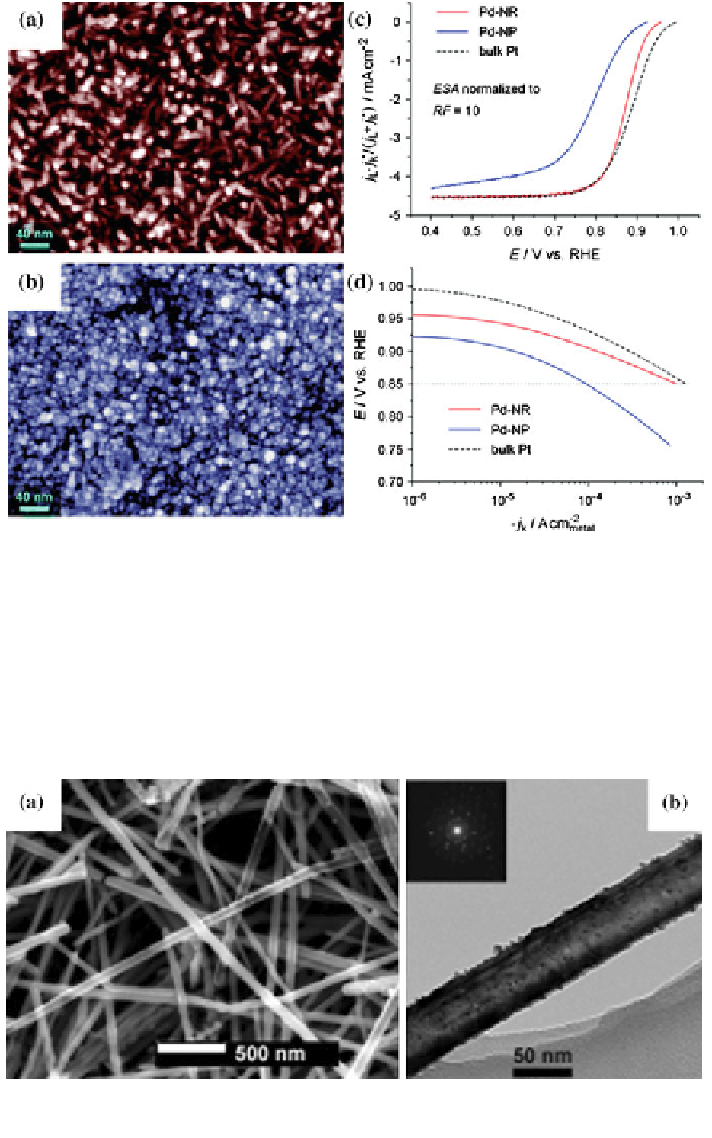
Fig. 1 SEM images of two typical morphologies of Pd obtained by adjusting the precursor
concentration and deposition time: a Pd nanorods (Pd-NRs), 3 9 10
-4
M PdCl
2
, 100 s; b Pd
nanoparticles (Pd-NPs), 1 9 10
-5
M PdCl
2
, 3000 s. ORR data for Pd-NR, Pd-NP, and bulk Pt,
obtained in an O
2
saturated 0.1 M HClO
4
solution at a rotation rate of 900 rpm and a scanning
rate of 10 mV s
-1
. c Normalized ORR profiles and d Tafel plots. The diffusion limited current
(j
L
) has been normalized to the geometric surface area (GSA), while the kinetic current density
(j
K
*) has been normalized to an electrochemical surface area (ESA) corresponding to a roughness
factor (RF) of 10. Reprinted from Ref. [
44
] with permission by the American Chemical Society
Fig. 2 a SEM image of PtPd nanotubes. b TEM image and electron diffraction pattern (inset)of
the PtPd nanotubes. Reprinted from Ref. [
75
] with permission by Wiley-VCH
Search WWH ::

Custom Search