Environmental Engineering Reference
In-Depth Information
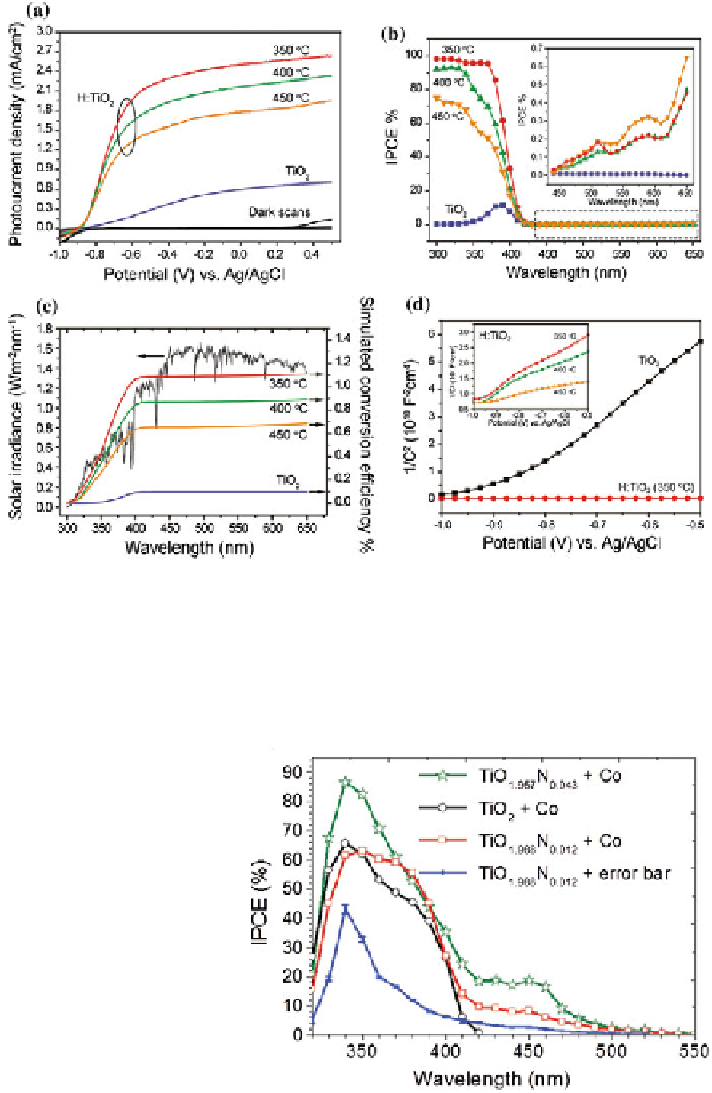
Fig. 6 a Linear sweeps of pristine TiO
2
and hydrogen treated TiO
2
(denoted as H-TiO
2
)
nanowire arrays in 1.0 M NaOH aqueous solution. b IPCE spectra of TiO
2
and H-TiO
2
at
different temperatures. c Integrating solar to hydrogen efficiencies of TiO
2
and H-TiO
2
nanowire
arrays. d Mott-schottky plots of TiO
2
and H-TiO
2
collected under dark condition at the frequency
of 10,000 Hz. Reproduced with permission from [
101
]
Fig. 7 IPCE spectra of TiO
2
and nitrogen doped TiO
2
with/without cobalt catalyst
modification, collected at the
potential of 1.4 V versus
RHE. Reproduced with
permission from [
31
]
Search WWH ::

Custom Search