Information Technology Reference
In-Depth Information
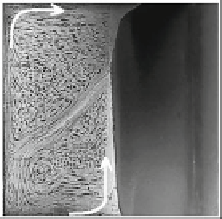
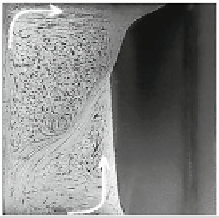
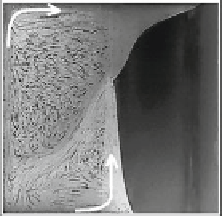
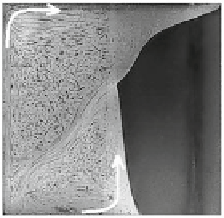
Fig. 12.17 Photographs of
the evolution of the melting
front produced by the
experimental procedure
t
*=60 min
t
*=90 min
t
*=120 min
t
*=150 min
The final result consists in the distinguished ice (white) and water (black) pixels in
each image.
After that it is possible to determine ice and water area, performing the sum of
the white and black pixels, respectively. Considering the reservoir dimensions and
the picture resolution, we calculate the volume of the solid and liquid state.
12.4 Results and Discussions
The photographs of the evolution of the melting front produced by the experi-
mental procedure are shown in Fig.
12.17
, and the isotherms and the evolution of
the melting front produced by the numerical procedure are shown in Fig.
12.18
.
The experimental and numerical tests show that the influence of the maximum
density is evident. The counterclockwise cell is close to the cold wall and the
clockwise cell is close to the hot wall. As the isothermal values of the dominant
cell are greater than T
M
, the melting front advances faster at the top of the cavity.
The incidence of the heated fluid normal to the interface is responsible for the
accelerated melting of ice at this point. These figures show a good qualitative
agreement on the evolution of shape of the melting front.
The evolution of the liquid fraction (melted fraction) of the experiment is
shown in Fig.
12.19
. The melted fraction is the ratio of the liquid volume to the
total volume of the enclosure. In the beginning of the process there were 50 % of
Search WWH ::

Custom Search