Information Technology Reference
In-Depth Information
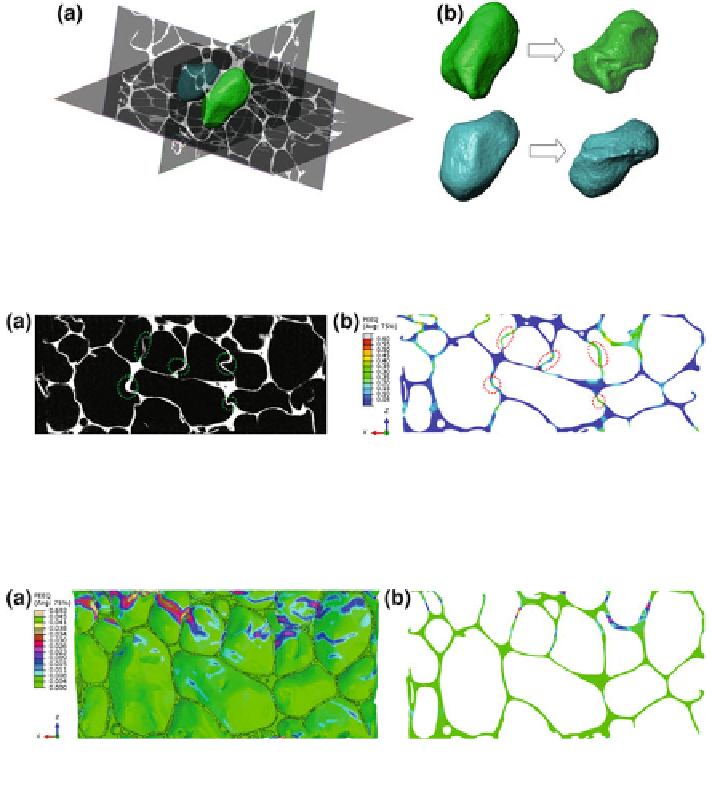
Fig. 10.5 a Two typical cells located in the centre of the foam specimen; b 3D deformation of
the central cells at a strain of 12.0 %
Fig. 10.6 Comparison of the cell deformation in the central XZ plane at a strain of 17.8 %:
a Slice image from CT data; b Numerical result (contour of the equivalent plastic strain in the
deformed configuration). The extensively deformed local portions of the cell walls are indicated
by the dotted ellipses
Fig. 10.7 Plastic strain distribution in the cell walls at a strain of 0.5 %: a Half of the solid body
viewed in the Y direction; b Cross-section in the central XZ plane
cause of the discrepancy between the tangent modulus and unloading modulus of
the linear part of the stress-strain curves observed in previous experiments [
9
].
10.4 Conclusions
In situ X-ray compression and image-based modelling are used to investigate the
low-strain-rate compressive behaviour of a closed-cell aluminium foam. Accord-
ing to the experimental observation, the compressive strength is mainly deter-
mined by cell collapse in the localised deformation bands. The CT images reveal
Search WWH ::

Custom Search