Information Technology Reference
In-Depth Information
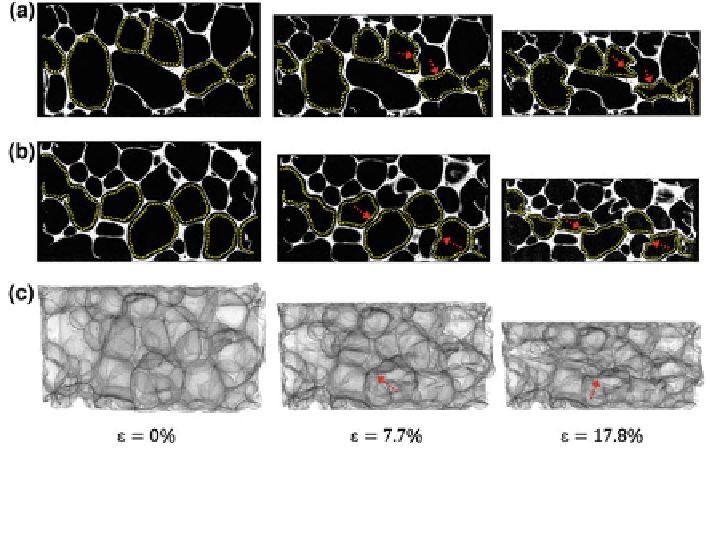
Fig. 10.4 Configurations of the foam specimen at different nominal strains: a Cross-section in
the central XZ plane; b Cross-section in the central YZ plane; c Translucent foam body to show
the 3D deformation of internal cells. The dotted lines indicate the cells in the localised
deformation bands and the arrows indicate the collapse modes of cell walls
images of the foam body are presented and compared, as shown in Fig.
10.4
c. It is
evident that shear deformation across cells is dominant on the cell level, see the
cells indicated by the arrows in Fig.
10.4
c, whereas both bending and buckling
occur at the smaller scale associated with cell walls, see the portions indicated by
the arrows in Fig.
10.4
a and b.
It reveals that the load distribution across the cells is very complicated even
when the foam is subjected to uniaxial compression. The 3D deformation of two
centrally located cells is shown in Fig.
10.5
and complex morphological changes
are clearly seen. These cross-sectional and 3D observations confirm that premature
cell collapse depends not only on the cell morphology but also on the actual load
the cell experiences.
Figure
10.6
shows a comparison between the experimental observation and the
numerical prediction. It is seen that the FE model predicts well the cell defor-
mation, including the location and mode of the collapse of cell walls. Some fine
features may be lost in the simulation because of the limited precision of the
reconstruction and the meshing. Nevertheless, the simulation captures the essential
deformation mechanisms and allows further computational analysis. For instance,
the equivalent plastic strain distribution in the cell walls can be obtained from the
simulation, and it indicates that extensive plastic deformation has already occurred
in some locations at a strain of 0.5 %, as shown in Fig.
10.7
, which is well before
the plateau stage is reached. Such local yielding at small strain is probably the
Search WWH ::

Custom Search