Information Technology Reference
In-Depth Information
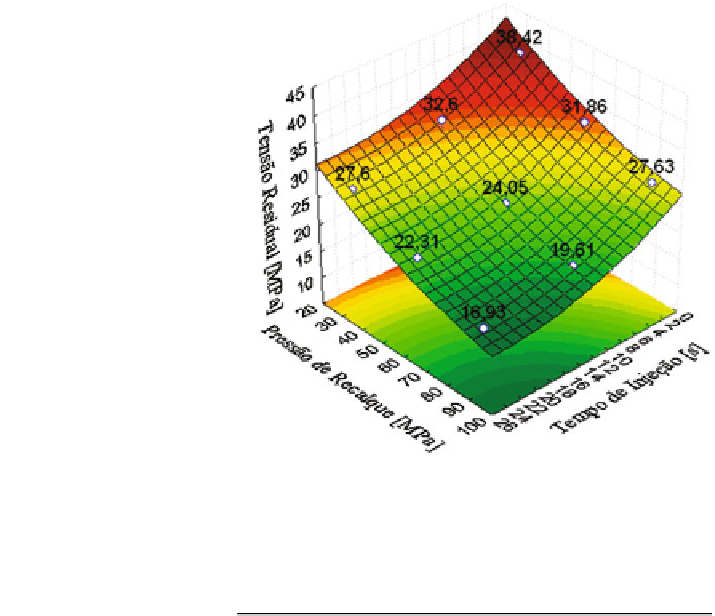
Fig. 8.10 Response surface
do experiment DOE2
Table 8.10 Equation
8.2
coefficients below
Equation
8.2
coefficients
a = 49.109512013923
d = 0.3531409979609
b = 0.9140054624976
e = 0.0013341269841
c = 0.0182262061609
f = 0.00013434089001
nine settings given in Table
8.7
. The key information obtained through the anal-
ysis of Fig.
8.10
is the confirmation of the presence of iso-areas of residual stress
values, previously demonstrated by experiment DOE1. Statistical validation of
experiment DOE2 was carried out through the analysis of the normal probability
chart (Fig.
8.11
), which shows an adequate behavior in relation to the normal ideal
distribution.
8.3.2.3 First Trial
Upon the response surface of Fig.
8.10
, the points corresponding to experiments 1
and 2 which were obtained through the injection molding process, and were
subjected to chemical attack were positioned. Respective settings can be seen in
Tables
8.11
and
8.13
, leading thus to Fig.
8.12
, further discussed.
Table
8.11
shows the main parameters used for the injection of specimens. The
main characteristic is that packing pressure is lower than injection pressure, which
led to different simulated residual stress in the trials.

Search WWH ::

Custom Search