Information Technology Reference
In-Depth Information
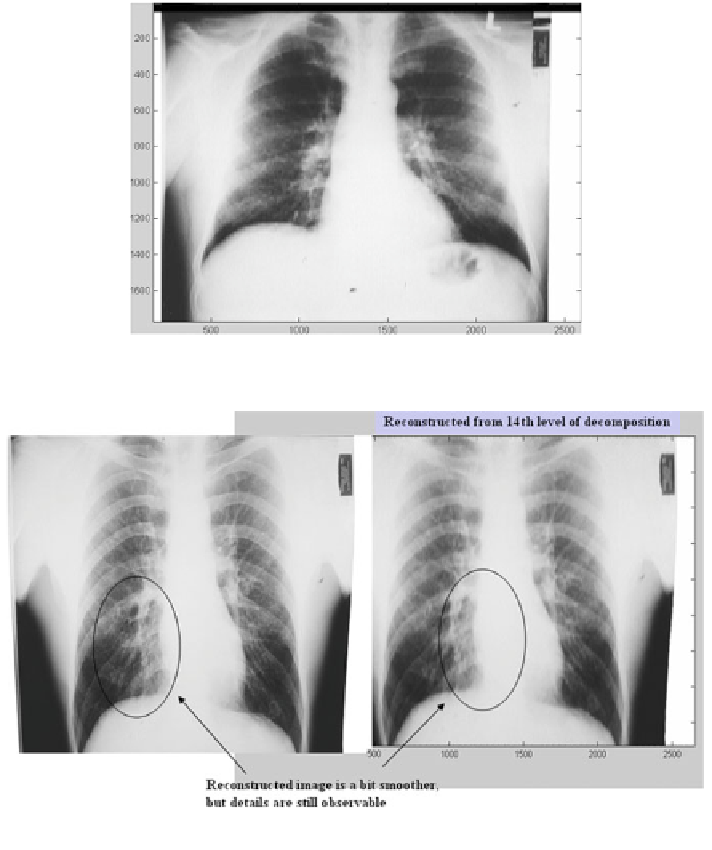
Fig. 6.5
Reconstructed image from the 14th level of decomposition
Fig. 6.6
Comparison of the original and reconstructed image
Figures
6.7
,
6.8
,
6.9
,
6.10
are the final part of the proposed algorithm—part of
visualization. Figure
6.7
is ROI designated by operator. Figures
6.8
,
6.9
,
6.10
are
different options in visualization chosen by operator.
An example of the X-ray processed with commercial software (CR = 100) is
shown in Fig.
6.11
.
Comparison with the commercial software:
• Commercial software uses decompositions till 10th level. Proposed algorithm is
tested till 14th level of decomposition.
• Commercial software does not use standard wavelets like in the proposed
algorithm.
Search WWH ::

Custom Search