Information Technology Reference
In-Depth Information
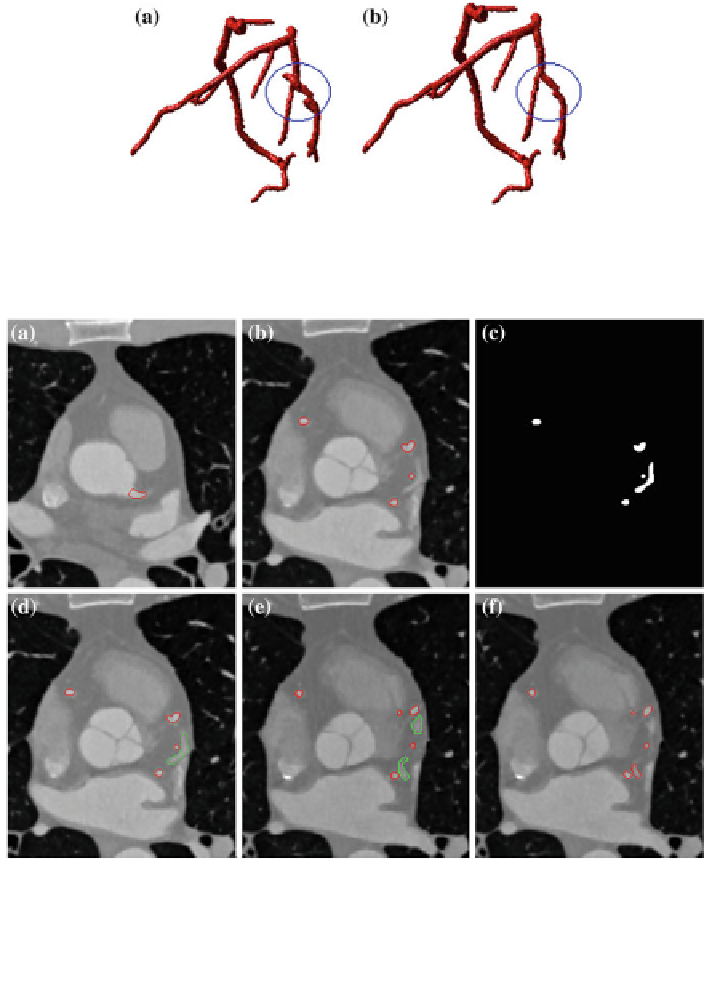
Fig. 5.12 The comparison a before and b after the correction process (datasets #7). The touching
non-arterial vessel (within the blue circle) has been removed
Fig. 5.13 Transaxial slices illustrate the slice-by-slice correction algorithm. a The first slice
contains the artery (delineated in red), b The artery is tracked through slices, c The binary image
obtained from the first stage segmentation, this is the first slice that contains the kissing vessel
(arrowed), d and e Kissing vessel is identified and tracked over slices (depicted in green
contours), f The original segmentation in same transaxial slice as shown in (e)
segments have relatively lower intensity values and lack image contrast. In
addition, we also found that the TP and OM rates of the proposed method tend to
decrease when approaching the distal and small segments of the arteries. However,
clinically significant coronary lesions are usually identified in the main and
proximal branches of the arteries, which can be well defined by the proposed
Search WWH ::

Custom Search