Information Technology Reference
In-Depth Information
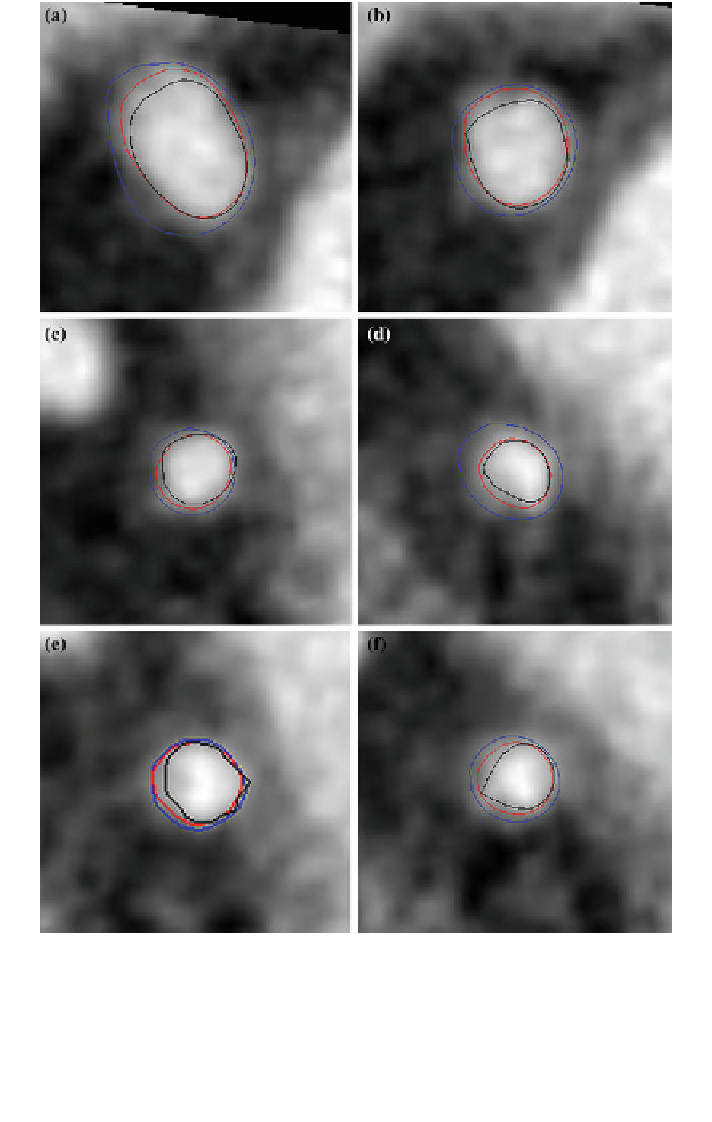
Fig. 5.11 2D transaxial images illustrating the segmentation results. a and b depict the resulting
segmentation on 2D cross-sectional images randomly taken from dataset #3, c and d depict the
resulting segmentation on 2D axial image from dataset #5, The examples of the segmentation
results on data #11 are illustrated in (e) and (f). The red contour represents the manually
delineated ground truth, while the segmentation obtained from the proposed method and Yang
et al. [
16
] method are shown in blue and black contours, respectively. Note that, the cross-
sectional images were up-sampled by a factor of five using linear interpolation to increase the
resolution
Search WWH ::

Custom Search