Database Reference
In-Depth Information
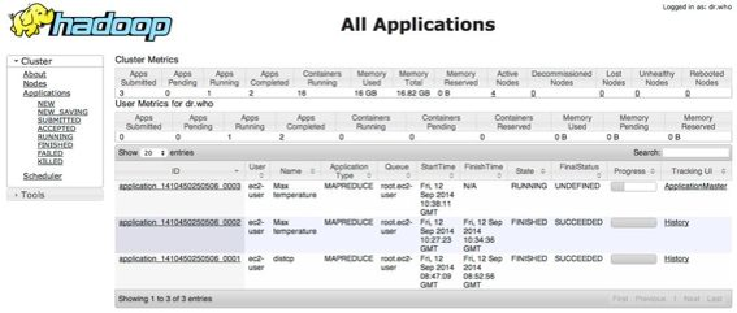
The resource manager page
A screenshot of the home page is shown in
Figure 6-1
.
The “Cluster Metrics” section
gives a summary of the cluster. This includes the number of applications currently running
on the cluster (and in various other states), the number of resources available on the
cluster (“Memory Total”), and information about node managers.
Figure 6-1. Screenshot of the resource manager page
The main table shows all the applications that have run or are currently running on the
cluster. There is a search box that is useful for filtering the applications to find the ones
you are interested in. The main view can show up to 100 entries per page, and the re-
source manager will keep up to 10,000 completed applications in memory at a time (set
by
yarn.resourcemanager.max-completed-applications
), before they
are only available from the job history page. Note also that the job history is persistent, so
you can find jobs there from previous runs of the resource manager, too.