Information Technology Reference
In-Depth Information
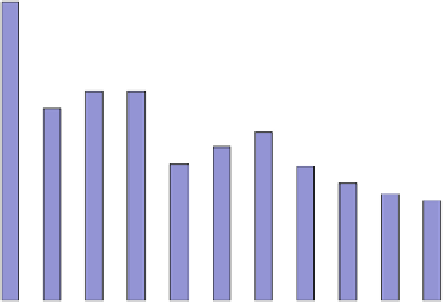
Percentage Graph (Model)
100%
90%
80%
70%
Third
Second
First
60%
50%
40%
30%
20%
10%
0%
Distance
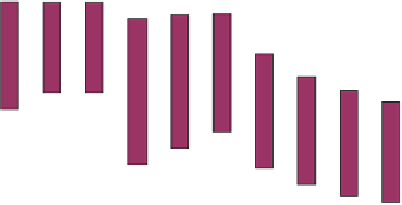
Mentor Choices Accumulative Percentage Distribution
100%
90%
80%
70%
Third
Second
60%
50%
40%
First
30%
20%
10%
0%
0.3
0.6
0.9
1.2
1.5
1.8
2.1
2.4
2.7
3
3.3
3.6
Distance
Fig. 14.7
Results of ally choice as structured bar charts: compare Fig.
14.3
just an average weight drawn from everyone's opinion. Similarly, the choice of ally
shows sufficient variation from the choice of 'like-mind' to suggest that there are
reasons for choice other than selecting a perceptual substitute. For clues to this we
will need to look at the details of the group discussion. This, unfortunately, has not
been done.
The model has shown similar behaviour to the experimental observations. Details
of model discussions would need to be explored to see what causes clustering of in-
terrogation and whether this is reflected in the observed behaviour of people. Further,
we can propose that some of the observed variation is the effect of dominance by