Environmental Engineering Reference
In-Depth Information
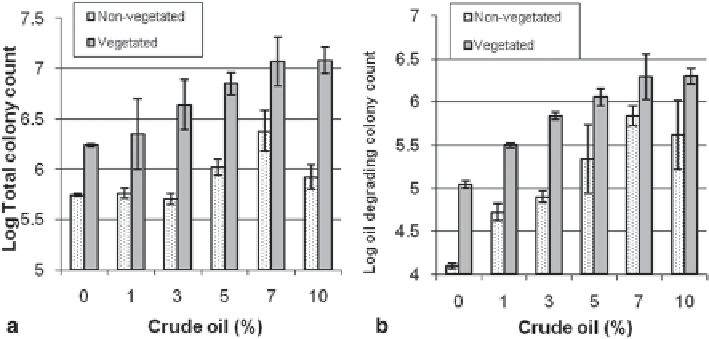
Fig. 10.2
Total colony count (CFU/g soil) after 2 months of planting (
a
). Oil-degrading colony
count (CFU/g soil) after 2 months of planting (
b
). (± SD,
n
= 3,
p
< 0.05)
biomass (roots + shoots) was also high in 0 % oil sample while it was low in 7 and
10 % oil samples. A sudden decrease in total dry biomass was observed in 1 % oil
sample in comparison with the control (0 %) sample. The length of leaves decreased
by increasing crude oil concentration; the shorter leaves were observed in 10 % oil
sample, while the tallest were noted in 0 % sample (Fig.
10.1b
). The number of
green plants at the end of experiment was lower in 10 % followed by 7 % oil sam-
ples, while the higher was observed in 0 % followed by 1 % oil samples (Fig.
10.1b
).
Colony Count
Total colony count was determined in the vegetated and the non-
vegetated soils (Fig.
10.2a
). In the vegetated samples, the higher microbial popula-
tion was observed in 7 and 10 % oil samples, the lower being in the control (0 %)
sample. Increasing the crude oil concentration increased total microbial popula-
tion in the vegetated samples. In the non-vegetated samples, the higher microbial
population was observed in 7 % oil sample, while the lower was observed at 0 %
sample. In all the vegetated samples, the total colonies were higher than those in
their equal concentration of crude oil in the non-vegetated samples. Counting for
the oil-degrading colonies in the vegetated samples showed that the higher micro-
bial population was also observed in 7 and 10 % samples and the lower was seen
in 0 % sample (Fig.
10.2b
). In the non-vegetated samples, the higher count for oil-
degrading colonies was observed in 7 % oil sample, while it was lower in 0 % oil
sample, In all the vegetated samples the oil degrading colonies were also higher
than those in their equal concentrations of crude oil in the non-vegetated samples.
Crude Oil Reduction
The crude oil reduction in the vegetated and the non-veg-
etated contaminated soils was measured and compared after 120 days (Fig.
10.3
).
The higher reduction was observed in 1% vegetated sample and the lower was
observed in 10 % in both vegetated and non-vegetated samples. Increasing crude
oil concentration decreased the reduction of crude oil in both vegetated and non-
vegetated samples. In all the contaminated vegetated soils, the reduction in crude oil