Biology Reference
In-Depth Information
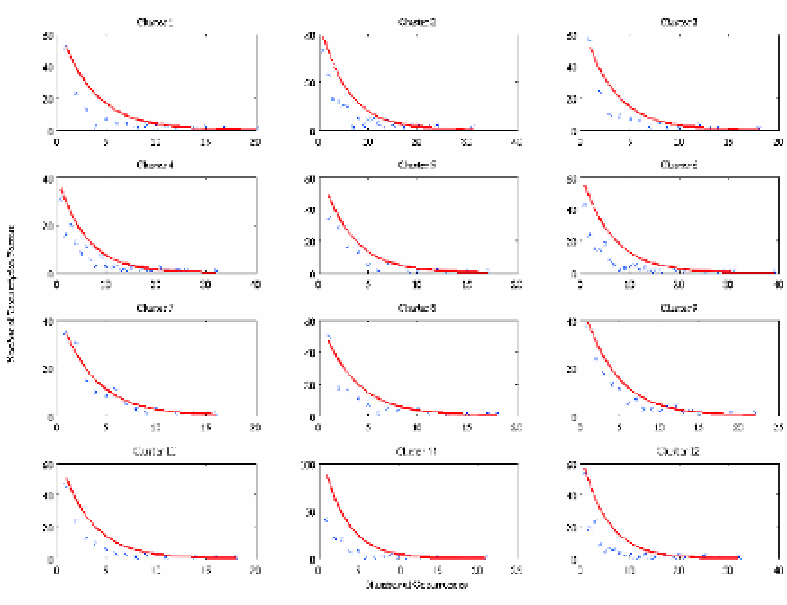
Fig. 3.6. The distribution of transcription factor connectivity from human vs. rat. The overall power
law distribution remains suggesting that while phylogenetic footprinting has eliminated a number of
false positives, the conserved promoter region does not differ in character to the overall promoter
region.
STAT5 and STAT6 is generally not surprising. What is questionable is whether
or not the aggregate properties of a predicted link provides an estimate for the
prevalence of a transcription factor. In the case for STAT5, it has been shown
experimentally that STAT5 indeed binds widely to genomic sequences in ChIP
(Chromatic Immuno-Precipitation) experiments [60].
In their experiment, Nelson et al. had observed that around 17% of the STAT5
transcription factors lies within 1k of the TSS (Transcription Start Site) [60]. Nel-
son et al., took around 7k of bases for analysis with 1k upstream for the promoter
region and 6k of exonic/intronic sequences. With this in mind the result is not sur-
prising. Since 1k upstream of the start site represents 1/6th of the exonic/intronic
sequence, its appearance 17% of the time is not surprising. This result suggests
that each transcription factor has an overall binding selectivity with an expected
appearance every n-bases. Therefore, if the position weight matrices are accurate
in terms of their relative promiscuity, we believe that the aggregate behavior of
the predicted transcription factor binding is a good substitute for empirical exper-


Search WWH ::

Custom Search