Biology Reference
In-Depth Information
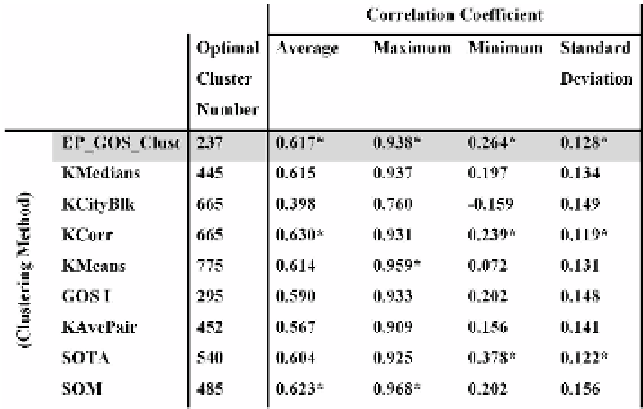
Table 16.1. Comparison of cluster correlation from the clustering of 5652 genes based on DNA ex-
pression levels in glucose pathway experiments. The comparison shows tha average correlation coeffi-
cients across all clusters for each clustering algorithm, the maximum and minimum coefficient, as well
as the standard deviation of the coefficients to give a sense of the spread of correlation displayed by the
clusters. The table also shows the optimal number of clusters predicted by each clustering approach.
The shaded row contains the results for EP GOS Clust and the top three performers for each correlation
performance indicator is marked with an asterisk.
largest clusters formed, as well as clusters formed in the later stages of the pro-
cedure and smaller-sized clusters to show good consistency and lack of size-
bias. The plots clearly show the tightness of the clustering throughout. To more
conveniently demonstrate the overall tightness of the clusters uncovered by the
EP GOS Clust as compared to other methods, we also find the Pearson correla-
tion coefficients of all the clusters uncovered.
Table 16.1 provides a summary of the cluster correlations, where in partic-
ularly the average correlation coefficient and the standard coefficient reflect the
overall tightness for all clusters. It can be seen that the EP GOS Clust compares
very well with other clustering methods in producing highly correlated clusters,
even against methods such as K-Corr that already explicitly uses correlation as
a metric for clustering and the correlation hunting SOM (see Table 16.1). The
data in the table for each clustering algorithm is obtained at the respective optimal
number of clusters predicted by the clustering balance.
We also evaluate our clusters by performing a functional search using the Gene
Ontology (GO) term finder on the SGD website (http://www.yeastgenome.org).
The biological coherence of each cluster is scored according to the percentage of
its genes covered by annotations significantly enriched in the cluster. From our


Search WWH ::

Custom Search