Biology Reference
In-Depth Information
z-scores:
1.4
5.85
3.82
1.79
2.02
2.34
1.55
1.19
-0.57
2
3
4
5
6
7
8
9
10
Number of Clusters, k
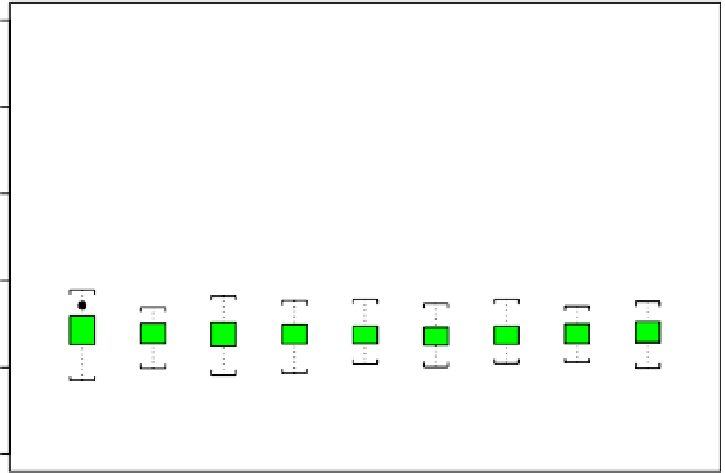
Fig. 15.7. Average silhouette coefficients vs. cluster size
k
computed from variables
V
1
,
V
2
and
V
3
(solid circles), together with boxplots of the ranges of average silhouette coefficients obtained for 100
independent random permutations of
V
2
and
V
3
.
Table 15.3. Summary of the stepwise clustering re-
sults from Sec. 15.6.1, giving the variables included,
the number of clusters
k
∗
, the average silhouette co-
efficients
S
∗
,andthe
z
-scores,
z
∗
.
k
∗
S
∗
z
∗
Va r i a b l e s
V
1
,
V
3
-
-
-
V
1
,
V
2
,
V
3
3
.
461
5
.
85
V
1
,
V
2
,
V
3
,
V
9
3
.
438
7
.
69
V
1
,
V
2
,
V
3
,
V
7
,
V
9
3
.
389
8
.
81
4
.
399
8
.
65
V
1
,
V
2
,
V
3
,
V
7
,
V
9
,
V
10
3
.
365
9
.
54
increase monotonically. In the example illustrating the influence of extraneous
variables discussed by Pearson
et al.
[16], the silhouette coefficient values also
decreased as additional — there extraneous — variables were added, but there the
corresponding
z
-scores decreased there rather than increased, as here. The sec-
ond point to note is the consistent optimality or near-optimality of
k
∗
=3over
all of the different variable subsets considered, suggesting stability but raising the
question of how the actual clusterings compare, the point considered next.


Search WWH ::

Custom Search