Biology Reference
In-Depth Information
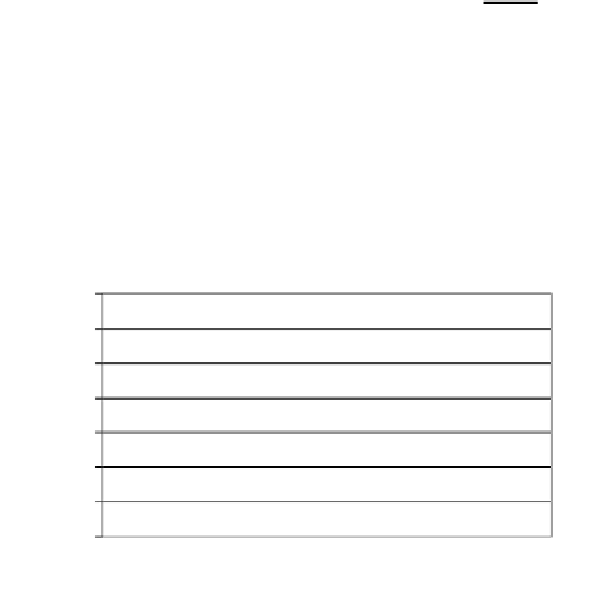
The time-dependent variations of the
D/T
ratios of the glycolytic and respiratory
genes were calculated as explained in the previous section. Fig. 12.4 illustrates
the temporal evolution of
D/T
ratios of the glycolytic and respiratory genes given
in Fig. 12.3. It should be pointed out that there are 2 less respiratory genes than
the one given in Fig. 12.3b due to missing values in the degradation rates. The
D/T
ratio for the
i
th
mRNA molecule (
DTR
i
)isdefined as
∆
n
D,i
∆
n
S,i
where
n
i
is the
number of the
i
th
mRNA molecules synthesized (
S
)ordegraded(
D
) per cell over
a given time period (see the previous section for more details). The calculation
of ∆
n
S,i
requires integrating the
TR
i
versus time curves between two sampling
time points, say
t
1
and
t
2
. This is why there are only 5
DTR
s
, each of which
was plotted at the mid-point of the two time points involved.
Degradation/Transacription (D/T) Ratios vs Time
= Glycolysis; = Oxphos
3.5
3.0
2.5
2.0
1.5
1.0
0.5
0.0
0
200
400
600
800
1000
Time (minute)
Fig. 12.4.
The temporal variations of the transcript-degradation/transcription (D/T) ratios of the 15
glycolytic (
) and 12 respiratory genes (
) given in Fig. 12.3.
12.4. Experimental Results
In our previous publication [10], we reported that, when yeast cells were grown
in a glucose-containing medium to exponential growth phase, harvested by cen-
trifugation, and resuspended in a galactose-containing medium replacing glucose,
extensive metabolic changes were found to occur as reflected in
TL
and
TR
values
for almost all of the 6,400 genes in the yeast genome. The
TL
trace averaged over
5,753-5,829 genes decreased by about 65% during the first 5 minutes following
the glucose-galactose shift and continued to decline until 360 minutes by further
20%.
There was a slight increase (17%) in
TL
between 360 and 450 minutes,


Search WWH ::

Custom Search