Biology Reference
In-Depth Information
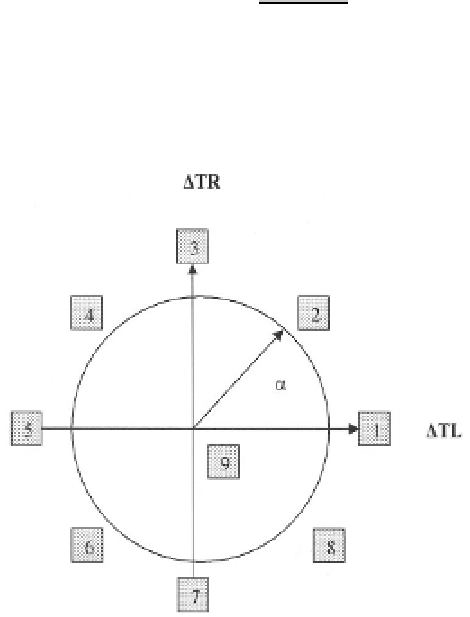
galactose shift and vector 2-3 between 5 to 120 min, etc.). Each vector can be
characterized in terms of the angle measured counterclockwise starting from the
positive
x
-axis (see Fig. 12.2). For example, vector 5-6 in Fig. 12.1a is approxi-
mately 45
◦
and vector 1-2 in Fig. 12.1b is approximately 225
◦
. Thus, the angle
α
determining the direction of the vector from the
i
th
point to the (
i
+1)
th
point in
a
TL
versus
TR
plot with coordinates (
x
i
,y
i
) and (
x
i
+1
,y
i
+1
), respectively, can
be calculated from the relation
α
=tan
−
1
[
(
y
i
+1
−y
i
)
(
x
i
+1
−x
i
)
]+Θ,whereΘ=0
◦
if both
the numerator and the denominator are positive, Θ = 180
◦
if either the numerator
is positive and the denominator is negative or both the numerator and the denom-
inator are negative, Θ = 360
◦
if the numerator is negative but the denominator is
positive.
Fig. 12.2. The “unit” circle whose
x
-axis indicates the changes in
TL
and
y
-axis those in
TR
values
of a trajectory in the
TL-TR
plot. The direction of the radius of the circle coincides with the direction
of the component vector of a
TL-TR
trajectory. For convenience, each direction is definedbythe
following values of angle
α
:
α
1
= 357
−
3;
α
2
= 3
−
87;
α
3
= 87
−
93;
α
4
= 93
−
177;
α
5
=
177
−
183;
α
6
= 183
−
267;
α
7
= 267
−
273;
α
8
= 273
−
357. The center of the circle denoted as
9 indicates that there is no change in
TR
nor in
TL
between two time points.
12.3. Statistical Analysis
The total number of genes whose
TL
and
TR
values were measured was 5,913, of
which 5,725 genes were successfully measured in triplicates without any missing
values. The rest of the genes were measured in less than triplicates. A statistical
analysis for the comparison between the “expected” and the “observed” distribu-


Search WWH ::

Custom Search