Biology Reference
In-Depth Information
neuron has the same shape, typically rectangle and hexagonal shapes. Neurons
constitute the lattice of the map. In this lattice map, each neuron has its neighbor-
ing neurons, which are determined by the shape of the neuron and the structure
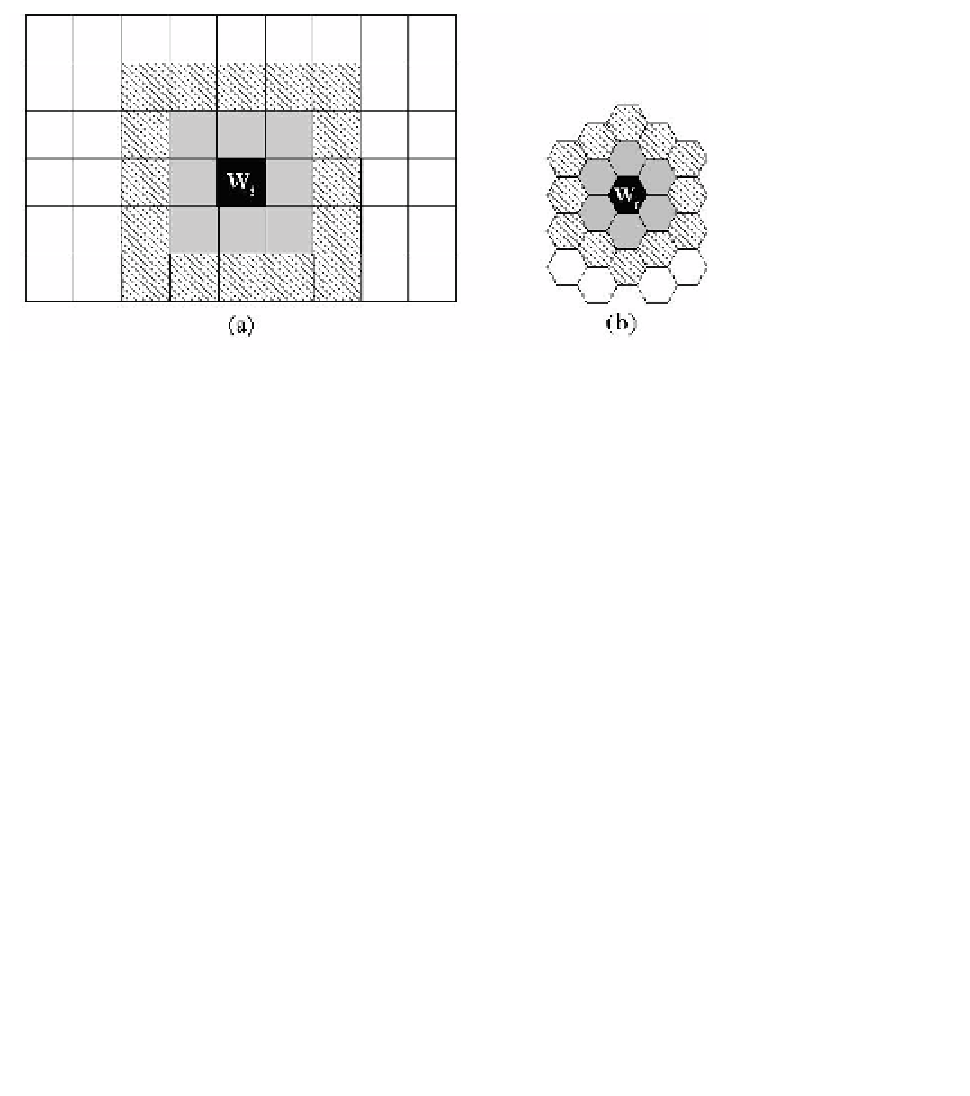
of the map. Figure 5.6 illustrates the structure of a 2-D SOM, and the definition
of neighboring neurons when the neuron has rectangle and hexagonal shapes. In
Fig. 5.6, the gray neurons are the nearest neighbors, and the neurons in slash lines
are the second nearest neighbors, of the neuron
i
shown in black, and so on. The
definition of the closeness of the neighborhood to a neuron is important in the
SOM algorithm, which will be shown soon.
Fig. 5.6. Structure of 2-D SOM with (a) rectangle (b) hexagonal neurons, the definition of neighbor-
ing neurons, and the closeness of neighborhood.
Each neuron in SOM is associated with a weight vector
W
with the same
dimension as each observation. As shown in Fig. 5.6, the weight vector of neuron
i
is denoted as
W
i
.
After the structure of the SOM, such as whether we use 2-D or 3-D SOM,
the shape of the neuron, the number of neurons
L
, ect, are determined, the SOM
algorithm for clustering analysis works in the following procedure:
(1) Initialize the weights associate with neurons by random numbers, and let the
iteration step
t
=0,
W
i
(
t
)=[
w
i1
(
t
)
,
w
i2
(
t
)
,...,
w
ip
(
t
)]
,
i
=1
,
2
,...,
L
.
(2) Draw a sample randomly from the dataset, denoted as
x
from the dataset
X
.
(3) Find the winner neuron
i
∗
with the associated weight vector
W
i
∗
according to
the maximum similarity (or minimal dissimilarity)
i
∗
=argmax
i
(
s
∗
(
x
,
W
i
))
or
i
∗
=argmin
i
(
d
∗
(
x
,
W
i
))
,
i
=1
,
2
,...,
L
(5.19)


Search WWH ::

Custom Search