Information Technology Reference
In-Depth Information
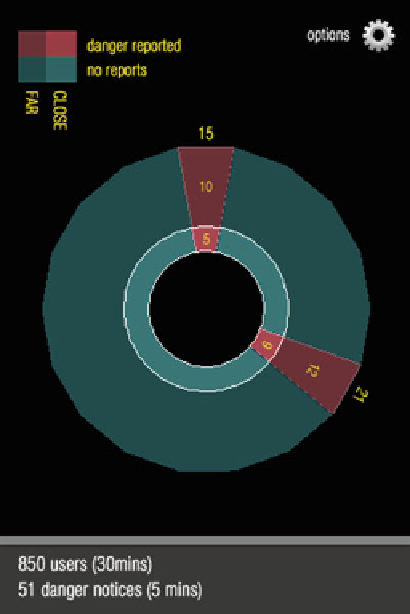
Fig. 14.2
The second
iteration of the design: a
rotating radial diagram
highlights the danger zones
14.5
User Experience of the Artwork
The artwork is currently available as a prototype application for iOS and Android
smartphones. It will be available on major stores as soon as the final beta-testing
stages are complete (estimated late January 2014) and interested parties can request
beta access by contacting the authors.
Throughout the interface design process we performed regular walks in the city
which we observed on social networks to better understand how the application
would transform our perception of the city.
The experience itself can be compared to the one of Rhabdomancy. While
walking amidst the spaces of the city while using the compass, the ordinary way-
finding reference items become less important. The color-coded intensity indicators
for the various emotions provide the sensation of being able to access a geiger
counter, or some sort of field intensity measurement device, showing the directions
in which a certain emotion is stronger.
The impossibility to access street and topography based directions, for example,
is strange at times sometimes. On the other hand, it gives the exact perception of
being able to access a different kind of geography: one that is based on the intensity