Environmental Engineering Reference
In-Depth Information
45000
40000
35000
30000
25000
20000
15000
10000
5000
0
1990
2007
2015
2020
2025
2030
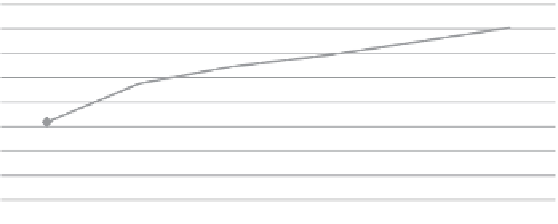
Total Energy-Related CO2 Emissions
Total Power Generation
Contributions to Power Generation CO2 Emissions by Technology
2007-2030
Increase
in million tons (Mt) of CO2
1990
2007
2015
2020
2025
2030
Coal-fired Power Generation
4929
8681
10556
11504
12680
13873
160%
Oil-fired Power Generation
1196
900
701
633
579
530
-59%
Gas-fired Power Generation
1346
2315
2562
2817
3085
3421
148%
Figure 1.4
. CO
2
Emissions Associated with Primary Energy Usage and Power Generation
Source
: IEA, World Energy Outlook (2010).
ppm will require CO
2
emission reductions in the range of 50 to 85% below
2000 levels by 2050; even if these targets are achieved, there is still no
guarantee that global warming can be kept below 2°C. In other words, at
the risk of stating the obvious, a revolution in how humanity generates
electricity is needed almost immediately to abate the worst impacts attrib-
uted to climate change. he popular belief is that facilitating such a tran-
sition requires nurturing a willingness to pay higher energy prices—but
as the next section details, in terms of electricity generation, this is not
necessarily true.
1.3.2 The Dynamics of Electricity Prices
Historically, the sluggish difusion of renewable energy has been rational-
ized in economic terms. Until recently, the cost disparity between fossil
fuel power options (speciically coal and natural gas) and renewable energy
alternatives has been capacious enough to discourage transition to alter-
native energy. However, fossil fuel prices have edged signiicantly higher
in recent years, substantially eroding this historical competitive cost
advantage.
High-grade US Northern Appalachian Coal exempliies the volatility of
fossil fuel prices. As Figure 1.5 illustrates, between December 2000 and
December 2003 the trading range of this commodity was between US$25-35