Geology Reference
In-Depth Information
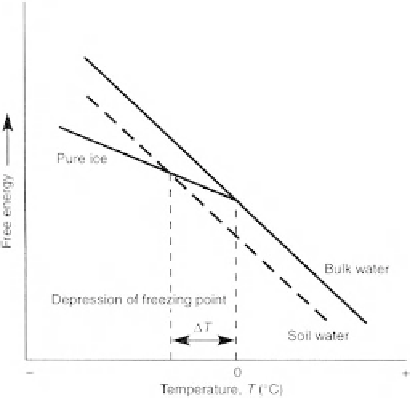
Figure
4.1.
Schematic diagram illustrating how the lower free energy of soil water, a weak
solution,leads to a depression of the freezing point. From Williams and Smith (1989). Reproduced
by permission of Cambridge University Press.
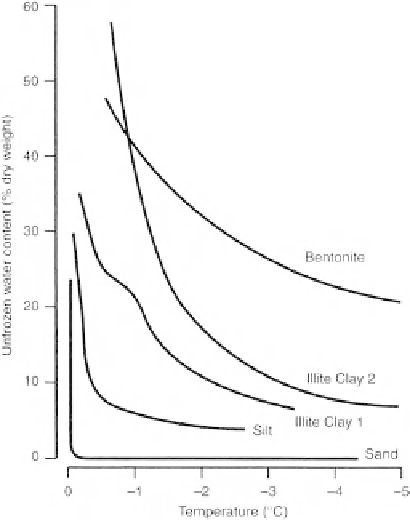
Figure
4.2.
Diagram illustrating the different amounts of unfrozen water existing in different
soils at temperatures below 0 °C. From Williams and Smith (1989). Reproduced by permission of
Cambridge University Press.
from solid particles. Thus, “frozen” soil still contains unfrozen water. However, as tem-
peratures fall, these fi lms become thinner. This explains how, in a series of laboratory
experiments, it can be demonstrated that different soils retain varying amounts of unfro-
zen water at temperatures below 0 °C (Figure 4.2).