Geology Reference
In-Depth Information
(A)
(B)
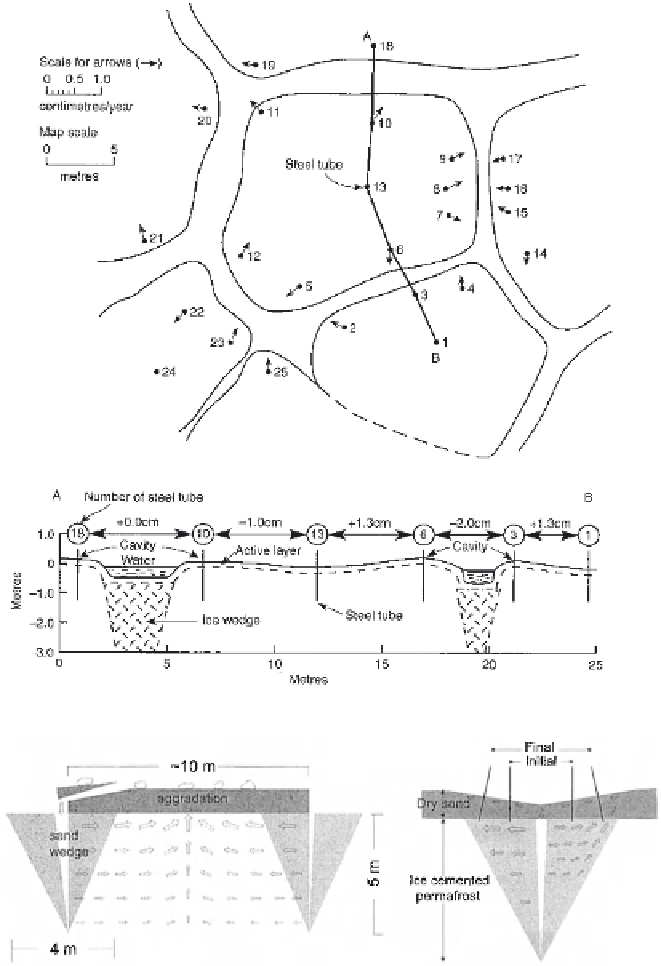
Figure 6.5.
Polygon deformation. (A) Garry Island, Mackenzie Delta region, Canada. The plan
sketch shows the location and direction of movement of steel rods between 1966 and 1978. The
cross-section between rods 1 and 18 indicates changes in the distance between rods, 1966-1978.
From: Mackay (1980a). (B) Hypothetical long-term soil motion in a sand-wedge polygon in Antarc-
tica. The left-hand diagram shows the assumed displacement fi eld and aggradation of polygon
surface due to wedge growth. There is equality between the volume of the infl ated surface and that
of the contributing halves of the wedge. Wind erosion forms a gravel lag at the surface; some mate-
rial is moved into the wedge. The right-hand diagram shows the typical displacement of steel rods
on either side of a sand wedge; the inner pair shows the initial position in 1962-1963 and the outer
pair shows the current (2002) position and inward tilt. The displacement fi elds are indicated by
arrows. From: Sletten et al. (2003).