Environmental Engineering Reference
In-Depth Information
found (as in plot sampling), count all individuals seen, regardless of where they
are, as well as measuring how far away each is. This can be implemented either as
line transects (equivalent to strip plots) or as point counts (equivalent to circular
plots). Line transects require that perpendicular distances between object and
transect line are recorded, while point counts record the distance from observer
to object.
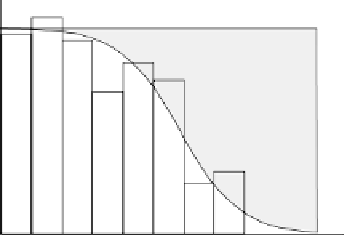
When the survey is complete, plot the frequency of observations against dis-
tance and fit a curve to the data (Figure 2.3). This curve, known as the
detection
function
, allows you to calculate an estimate of the proportion of objects present
that were seen. Conceptually, the area under the detection function represents the
total number seen, while the area within the rectangle bounded by the maximum
distance and the maximum of the detection function represents an estimate of the
total number present. The ratio of these two areas therefore gives the proportion
seen,
p
. Given a certain number of objects seen,
n
, density can then be simply
estimated by using
p
as a correction factor, and dividing by the effective area
surveyed. For line transects of total length
L
and maximum detection distance
w
,
density is given by:
N
Lwp
ˆ
Alternatively, for a total of
C
point counts, density is given by:
ˆ
N
w
2
p
C
Fitting detection function models to data is made easy and accessible by free
software DISTANCE (Section 2.7.1). Literature associated with this programme
(Buckland
et al
. 2004 and programme help files) covers in detail the analytical
Detection function
Unseen
Seen
0
Distance
Fig. 2.3
A hypothetical detection function fitted to line transect data, indicating
seen and unseen portions of the population. The transect line is at zero distance.