Environmental Engineering Reference
In-Depth Information
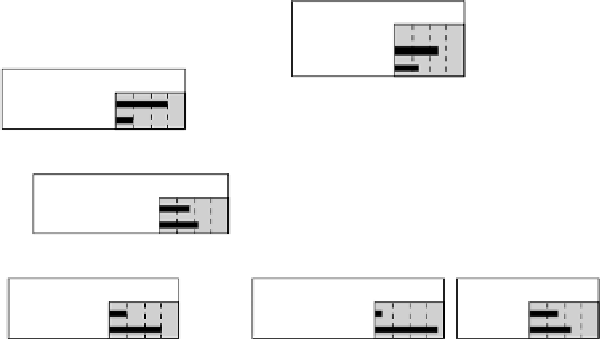
So CPUE is directly influenced by fisher density and the level of control
and surveillance. Behind each of the nodes is a conditional probability table, for
example showing the probability that fisher representation on the management
body is high as a function of management type and whether the management
body is democratically elected. These probabilities can be obtained from any
source, such as quantitative data or expert opinion (in this case, it was by using a
logistic regression to analyse quantitative data).
Management
type
govt
co mgt
trad
3.57
61.4
35.0
Stability
stable
unstable
74.0
26.0
Democratically
elected
no
yes
43.5
56.5
Respectability
lo med
hi
Fisher representation
Number of gears
23.3
76.7
lo
med hi
9.63
90.4
lo
hi
42.5
57.5
Clear access
rights
Conflict resolution
no
yes
no
yes
2.53
97.5
9.84
90.2
Poaching
Control and surveillance
lo
med hi
75.7
24.3
lo
med hi
2.89
97.1
Fisher density
lo
hi
60.8
39.2
Compliance
CPUE change
declining
static rising
Equity
lo
med hi
0
100
0
100
lo
hi
0
100
Fig. 5.9
Network model with all three output nodes set at the desirable
outcome (showing backward propagation of probabilities—if we know which
sustainability outcome we want, we can see what characteristics of the fishery
are more or less likely to lead to to this outcome).