Environmental Engineering Reference
In-Depth Information
TABLE 4.3
Conversion and Losses of Various Wetland Types Including Agricultural and Urban
Uses from the Mid-1970s to the Mid-1980s in the United States
a
Conversion
Wetland
Amount in
Amount in
Total loss
Urban
to other
type
mid-1970s
mid-1980s
(gain)
Agricultural
land use
Deep water
Other
wetland types
Swamps
223000
209000
14000
4000
240
200
4360
5200
Marshes
98000
99000
1000
1500
150
0
350
3000
Shrubs
63000
62000
1000
1000
0
0
1700
1700
Ponds
22000
25000
3000
900
0
0
1800
300
Total
406000
396000
11000
5600
390
200
4600
200
a
Deep water represents conversion to lakes or reservoirs and conversions are placed in the “other” category if
they are not to agriculture, urban, or deep water. Values are given in thousands of square kilometers. Positive
values indicate a net gain (data from Dahl
et al.
, 1991).
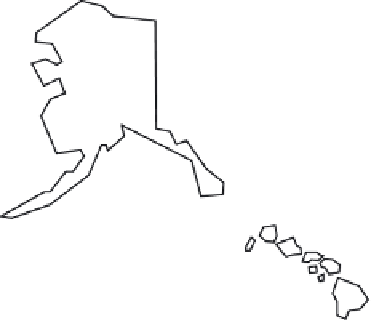
glades have been lost since pre-European times (Mitsch and Gosselink,
1993). This degree of loss is typical for all types of wetlands in the United
States. Twenty-two states have lost more than half of their wetlands in the
past 200 years (Fig. 4.11). The amount of loss and interconversion among
wetland types has been great (2.5% lost over a period of 10 years) and
driven primarily by agriculture. The creation of small ponds from wet-
lands is an important aspect of human activities (Table 4.3). Peatlands are
under pressure throughout the world as a source of peat moss for gar-
dening. In Southeast Asia, existing wetlands have been modified or new
60
56
54
50
74
56
85
90
73
52
85
87
50
91
87
81
59
67
72
50
59
52
FIGURE 4.11
States that have lost 50% or more of their wetlands since 1780, labeled with
percentage lost (data from Dahl
et al.,
1991).


Search WWH ::

Custom Search