Environmental Engineering Reference
In-Depth Information
Total = 902
Total = 541
Net photosynthesis
(672)
Aerobic terrestrial
respiration (246)
Trees
13800
Net photosynthesis
(17)
Detritus
litter 500
logs 200
sediment 7500
Shrubs
and
herbs
15-25
Litter (345)
Net photosynthesis
(14)
Aerobic aquatic
respiration (46)
Algae
Precipitation (1.5)
Anaerobic aquatic
respiration (10)
Precipitation (0.9)
Respiration (26)
Streams (192)
Dissolved organic C
0-10
Streams (214)
Groundwater (1.2)
FIGURE 22.12
Carbon biomass and flux rates for the Creeping Swamp ecosystem. Biomass
in g C m
2
is listed in the compartment boxes, and flux rates in g C m
2
year
1
are listed
in parentheses (data from Mullholland, 1981).
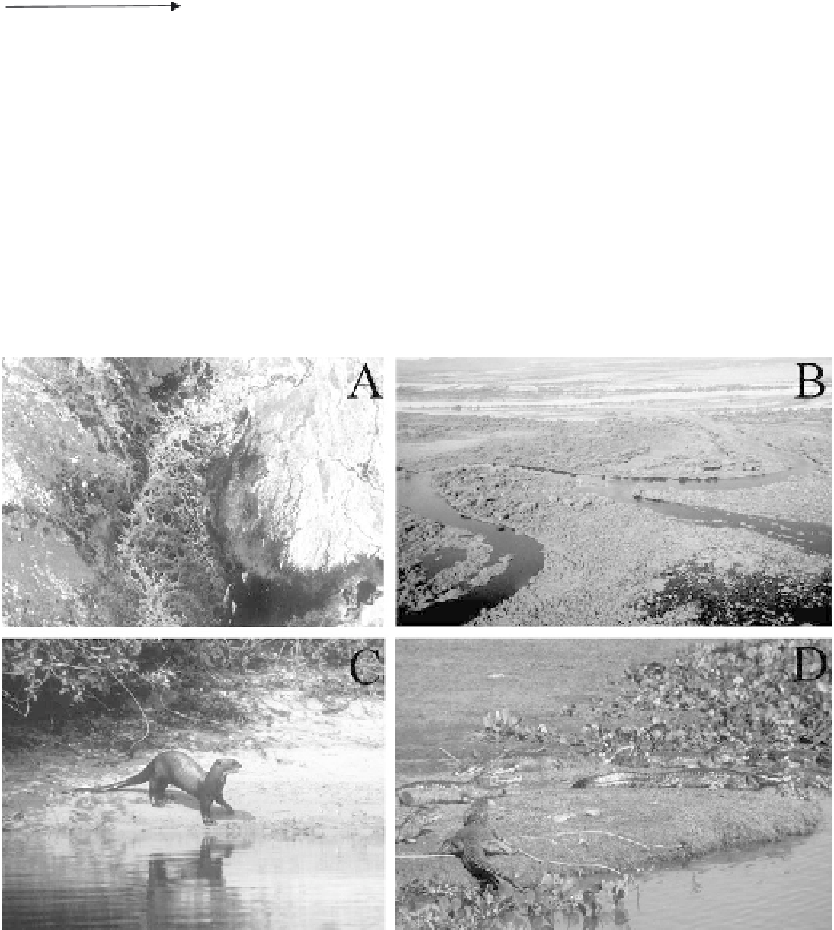
FIGURE 22.13
Scenes from the Pantanal: (A) satellite view of the numerous small patches
of surface water, (B) areal photo of a main channel and adjacent flooded areas, (C) a giant
river otter
(Pteronura brasiliensis),
and (D) caimans
(Caiman yacre)
congregate around a pool
that remains during the dry season (images courtesy of Steve Hamilton).


Search WWH ::

Custom Search