Environmental Engineering Reference
In-Depth Information
S
S
S
w
S
p
S
w
S
p
FIGURE 22.6
A diagram of nutrient spiraling in streams.
S
is the total spiral length,
S
p
is
the time spent in particulate form in water column or the benthos and
S
w
is the average time
spent in the water. Average velocity is greater in the riffle on the left, so spiral length is greater
than in the pool at the right.
gests that dams disrupt the expected natural river continuum. Dams can
cause settling of organic particles and boost populations of zooplankton
and phytoplankton downstream. Exceptions not withstanding, the concep-
tual model provides one way for stream ecologists to think critically about
streams in their ecosystem context (Cummins, 1977; Cummins
et al.,
1984).
LAKES AND RESERVOIRS
One general way to classify lake ecosystems is based on lake trophic
state (Table 22.3). Oligotrophic lakes are not very productive and are lim-
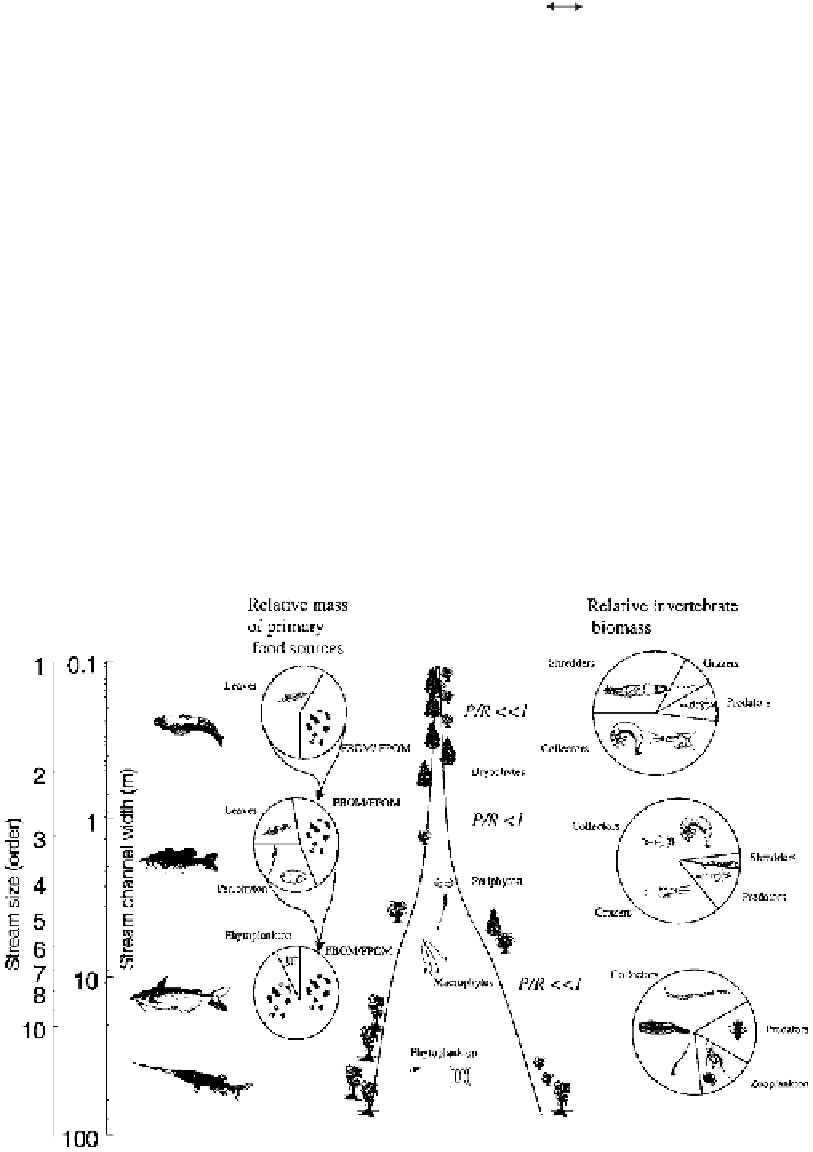
FIGURE 22.7
Diagram of the river continuum concept. See text and Table 22.2 for expla-
nation (modified from Vannote
et al.,
1980).


Search WWH ::

Custom Search