Environmental Engineering Reference
In-Depth Information
particles using a flash of known duration. The length of the particle path
on the photographs can be related to the flash duration, and water veloc-
ity can be calculated. Pitot tubes are small tubes with one end extending
above the surface of the water and that have a 90° bend, which allows the
open end of the tube that is under water to be positioned facing upstream.
As water velocity increases, the pressure at the end of the tube increases,
and the height of the water in the tube above the external water level in-
creases. Pitot tubes are inexpensive but are not sensitive to low water ve-
locity and foul easily.
Hot film, wire, or thermistors can be used to measure water velocity.
These devices operate on the principle that moving water carries heat away
from objects. Electronic circuitry can be used to relate water velocity to the
cooling effect on the heated electronic sensor. These heat-based devices are
most useful for biological and ecological investigations of the effects of wa-
ter velocities on organisms, when low velocity and small spaces are most
common.
Recently, acoustic Doppler velocity (ADV) and laser Doppler velocity
(LDV) methods have been used to measure water velocity. These methods
rely on reflection of sound and light waves, respectively, from small parti-
cles in the flowing water. ADV and LDV are very useful because they al-
low determination of velocity in all three directions. Drawbacks include in-
ability to sense velocity in confined spaces and high cost of the equipment.
to pull it back. An additional consequence of scale and flow is reduced flow
for organisms that live very close to large surfaces (within approximately
0.1 mm, depending on flow velocity and surface geometry).
An interesting aspect of movement through water at a low Reynolds
number is the effect a wall has on microbes swimming near solid surfaces.
A 1-
m-diameter bacterium swimming 50 body widths from a wall
is slowed because friction with the wall is transmitted through a fluid.
Thus, when microbes are observed swimming in a drop of water confined
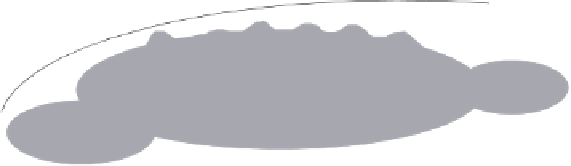
Direction of Current
Outer edge of flow boundary layer
Substrata
FIGURE 2.8
Schematic of thickness of the flow boundary layer as a function of surface
roughness and distance from leading edge. Water is flowing from left to right. Picture the sub-
strata as a rock in a stream. The thickness of the boundary layer increases with distance from
the leading edge and is shallower over bumps and deeper over depressions.


Search WWH ::

Custom Search