Environmental Engineering Reference
In-Depth Information
The nonequilibrium view of disturbance and its relationship to com-
petition as a determinant of species diversity has been termed the dynamic
equilibrium model (Huston, 1994). This model explains some responses to
disturbance by stream invertebrate communities (McCabe and Gotelli,
2000). In a study by McCabe and Gotelli, frequency of disturbance did not
decrease species richness, but intensity and area of disturbance did alter
richness. Similarly, the dynamic equilibrium model was consistent with
riparian plant richness in riverine wetlands in Alaska (Pollock
et al.,
1998).
In the study by Pollock
et al.,
plant productivity (a gauge of competition)
altered the effect of disturbance on species richness.
The response to disturbance depends on the ability of colonists to
reach an area (Cushing and Gaines, 1989), the severity of the disturbance,
and the existence of refugia (Townsend, 1989; Lancaster and Hildrew,
1993). The harshness of disturbance in an aquatic environment is exem-
plified by research on recovery of macroinvertebrate species found in in-
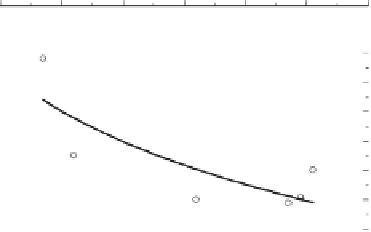
termittent prairie streams following flooding and drought. Fritz (1997)
documented that species richness could be predicted as a function of length
of drought, severity of flood, time since flooding or drought, and distance
from spring-fed pools that served as refuges from disturbance (Fig. 20.4).
Consideration of natural disturbance dynamics is crucial in wetland
restoration (Middleton, 1999). Such disturbance includes flood pulses, fires
(De Szalay and Resh, 1997), hurricanes, beaver activity, and herbivory. A
60
A
50
40
30
20
10
0
1.1
B
1.0
0.9
0.8
0.7
0.6
0.5
20
30
40
50
60
70
80
Harshness index
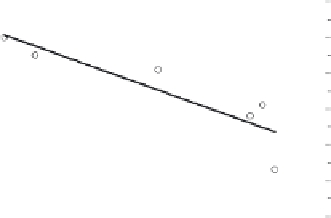
FIGURE 20.4
Relationship between macroinvertebrate species richness (A), Shannon diver-
sity (B), and a harshness index in Kings Creek, Kansas. The harshness index is a score based
on time since flood or drought, intensity of last flood or drought, and the distance from
sources of new colonists. A higher index indicates a harsher habitat. The two points on the
left are from permanent sites; the rest are from intermittent sites. Both lines are statistically
significant (
p
0.05; data from Fritz, 1997).


Search WWH ::

Custom Search