Environmental Engineering Reference
In-Depth Information
7
6
5
Uptake
4
3
2
1
-0
-1
Stable point
-2
-3
-4
Regene
r
ation (negative bec
a
use i
t
i
s
a ne
t
supply)
-5
0
1
2
3
4
5
6
7
8
9
10
μ g L
-1
)
Nutrient concentration (
FIGURE 16.8
Graphical representation of the idea that nutrient uptake and regeneration
can stabilize dissolved nutrient concentrations. The graph illustrates a net increase in nutri-
ents (excess regeneration) when nutrient concentrations are low and a net decrease (excess
uptake) when nutrient concentrations are high (redrawn from Dodds, 1993).
the importance of remineralization in wetlands, particularly those with lim-
ited hydrological nutrient inputs (Bridgham
et al.,
1998), a balance should
also occur in them.
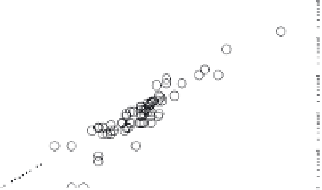
Meaningful discussion about system dynamics is difficult if only the
dissolved inorganic nutrient concentrations are known because rates of up-
A
10
3
10
2
10
1
NH
4
+
10
0
10
0
10
1
10
2
10
3
10
2
B
10
1
10
0
10
-1
PO
4
3-
10
-2
10
-3
10
-3
10
-2
10
-1
10
0
10
1
10
2
Uptake (nmole L
-1
h
-1
)
FIGURE 16.9
Uptake and remineralization from a variety of surface waters. Note the ap-
proximate 1:1 correspondence between the rates (reproduced with permission from Dodds,
1993).


Search WWH ::

Custom Search