Environmental Engineering Reference
In-Depth Information
2.0
1.6
Anabaena
Scenedesmus
A
1.2
0.8
0.4
0.0
0.0
0.1
0.2
0.3
0.4
0.5
0.6
S (mg L
-1
)
0.3
0.2
B
0.1
0.0
0.0
0.1
0.2
0.3
0.4
0.5
0.6
S (mg L
-1
)
0.4
0.3
0.2
C
0.1
0.0
0.00
0.05
0.10
0.15
Q (g/g)
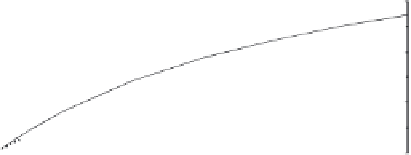
FIGURE 16.3
Graphical representations of the equations used in Example 16.1 for uptake
and growth as a function of nutrients for two algae: (A) Michaelis-Menten uptake, problem
1; (B) Monod growth, problem 2; and (C) Droop growth, problem 3.
max
) are controlled by nutrient supply, tem-
perature (Fig. 15.3; Eppley, 1972), light (see discussion on photosynthe-
sis-irradiance relationships in Chapter 11), pH, and other factors. Logi-
cally, growth rate is related more directly to nutrient concentration inside
([
Q
]) than outside the cells. The relationship between internal nutrient con-
centrations and growth is called the
Droop equation:
Maximum growth rates (
Q
0
Q
max
1
where
max
is the maximum growth rate,
Q
is the cell
quota (concentration inside the cell), and
Q
0
is the minimum cell quota (the
concentration in the cell below which no growth occurs; [Fig. 16.2B]). Typi-
cal values for the constants in the Droop equation can be found in Table 16.1.
This equation is useful if internal nutrient concentrations can be determined.
The final step is to link growth to external nutrient concentration.
Growth can be related to concentration of nutrients outside the or-
ganism by the
Monod equation:
is the growth rate,


Search WWH ::

Custom Search