Environmental Engineering Reference
In-Depth Information
24
22
20
18
16
14
12
10
8
6
4
2
0
3
4
5
6
7
8
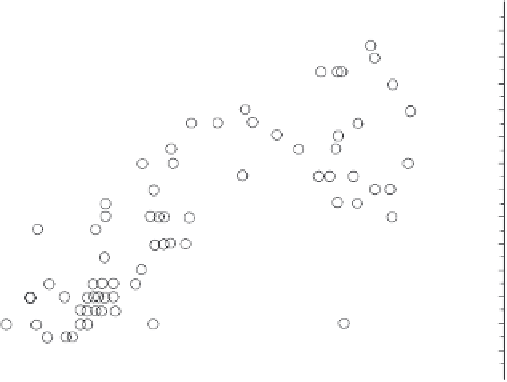
pH
FIGURE 14.11
Crustacean species diversity as a function of pH (reproduced with permis-
sion from Freyer, 1980).
(Biography 14.2). Another possible solution is to fertilize the lake and al-
low the biota to reverse the problem (Davison
et al.,
1995), but as discussed
in Chapter 17, eutrophication has its own problems.
Emission controls have led to recent decreases in acid deposition in
North America and Europe and associated reversals in surface water acid-
ification (Stoddard
et al.,
1999). Some areas have not recovered in North
America. Those watersheds were so heavily impacted by acid deposition
that they were not able to respond to decreased sulfate loading.
700
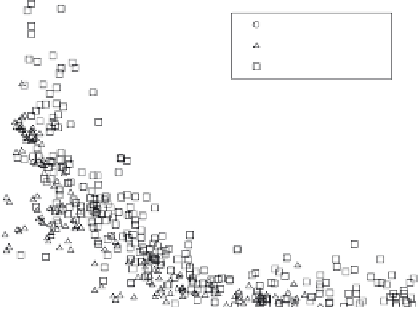
Pennsylvania
Catskills
Adirondacks
600
500
400
300
200
100
0
4.0
4.5
5.0
5.5
6.0
6.5
7.0
7.5
pH
FIGURE 14.12
Relationship of aluminum concentrations to pH (reproduced with permis-
sion from Wigington
et al.,
1996).


Search WWH ::

Custom Search