Environmental Engineering Reference
In-Depth Information
02468 0 2 4
6
0
A
4
8
12
Oxygen
Temperature
16
20
.
L
-1
)
O
2
(mg
0
5
10
14
19
0.5
B
0.0
-0.5
-1.0
-1.5
-2.0
-2.5
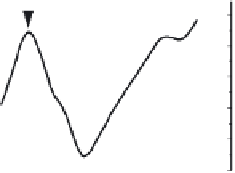
FIGURE 11.12
O
2
profiles from the stratified Triangle Lake, Oregon, on October 1, 1983,
mid-morning (A) and from the South Saskatchewan River in an active algal mat, midday on
June 9, 1993 (B). Note the lack of O
2
in the hypolimnion and the possible deep photosyn-
thetic activity (at 10-14 m) that causes a slight increase in O
2
in A and the supersaturating
O
2
concentration at the sediment surface (B) (data for A courtesy of R. W. Castenholz; data
for B from Bott
et al.,
1997).
10
8
Littoral
9
6
8
4
A
B
7
2
Pelagic
6
0
5
0800 1200
1600 20
00
2400
Time (h)
Date
10
11.2
Light off
11.0
8
10.8
6
Light on
C
10.6
4
D
10.4
2
10.2
000
0400
0
1
2
3
4
0800 1200 1600 2000
Time (min)
Time (h)
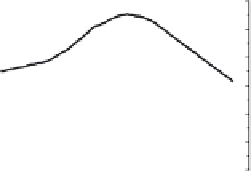
FIGURE 11.13
Temporal variation in O
2
in Kansas groundwater (A), the pelagic and lit-
toral zones of an Indiana lake (B), a periphyton assemblage (C), and a stream (D) (data in
(A) courtesy of Konza Prairie Long-Term Ecological Research Site; data in (B) from Scott,
1923; C, original data; D, Odum, 1956).


Search WWH ::

Custom Search