Environmental Engineering Reference
In-Depth Information
ice
0
2
2
4
6
8
10
12
14
Apr May Jun Jul Aug Sep
Oct Nov Dec Jan Feb Mar
Temperature (
0
C)
0
5
10 15 20
0
5
10 15 20
0
5
10 15 20
0
5
10 15 20
0
2
4
6
8
10
12
14
Spring mixing
Summer stratification
Fall mixing
Winter stratification
FIGURE 6.10
A depth contour plot of lake temperature over the course of a year in a dim-
ictic cold-temperate lake (Esthwaite Water, an English lake). The thick black line at the top
right corner of contour plot indicates ice cover. (Bottom) Two-dimensional representations of
the temperature versus depth at each phase of stratification (data from Mortimer, 1941).
The epilimnion is very stable relative to the ability of the wind to mix
a lake. There can be some mixing of the top of the hypolimnion
(entrain-
ment)
with extreme winds, but even hurricane-force winds will not fully
mix a well-stratified lake (Fig. 6.12). The stratification will break down
only when the autumn weather can cool the epilimnion to approximately
the same temperature as the hypolimnion. Cool air coupled with contin-
ued heat losses from surface evaporation decrease the temperature of the
Temperature (
0
C)
02468 0 2 4 6 8
0
Epilimnion
5
Metalimnion
(thermocline)
10
15
Hypolimnion
20
25
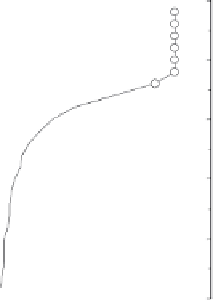
FIGURE 6.11
Temperature as a function of depth for Triangle Lake, Oregon, on October 1,
1983, and positions of epilimnion, metalimnion, and hypolimnion (data from R. W. Castenholz).


Search WWH ::

Custom Search