Environmental Engineering Reference
In-Depth Information
1000
Erosion
100
10
Transport
1
Sedimentation
0
10
-3
10
-2
10
-1
10
0
10
1
10
2
10
3
Size (mm)
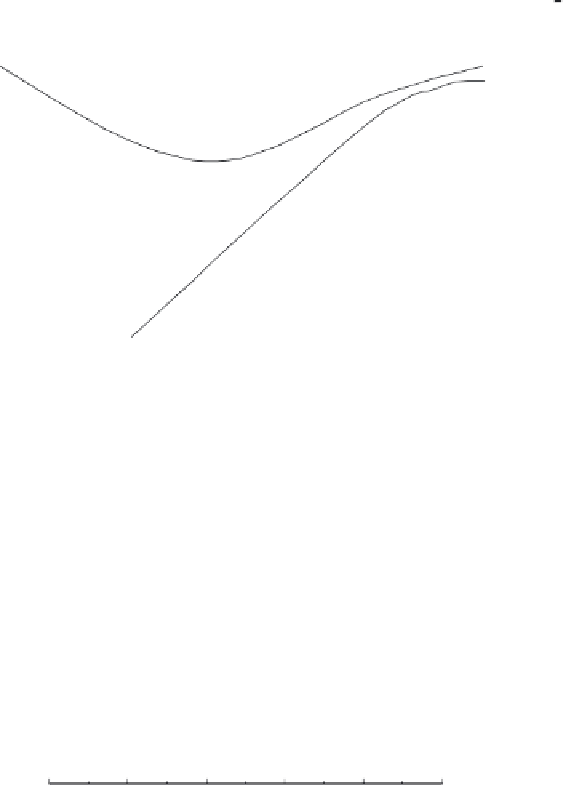
FIGURE 5.17
Transport and erosion of particles as a function of water velocity. Note that
the lines delineating transitions between erosion, transport, and sedimentation represent fuzzy
rather than abrupt transitions (after Allen, 1995 and Morisawa, 1968).
0
A
1
2
3
0.0
0.5
1.0
1.5
2.0
2.5
Sediment concentration (g L
-1
)
0
B
1
2
3
0 102030405060708090100
Sediment concentration (% bottom concentration)
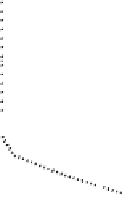
FIGURE 5.18
Distribution of particles with depth in the Missouri River expressed as total
particle concentration (A) and as percentage concentration of bottom sediments for different-
sized particles (B) (data plotted from Wilber, 1983).
87


Search WWH ::

Custom Search