Information Technology Reference
In-Depth Information
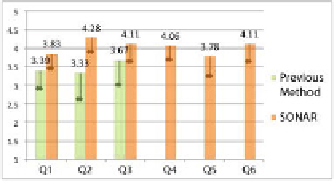
and the error bars atop each histogram shows standard deviation. Table.3 shows t-test
results. There was a significant di
ff
erence in the 5% range for questions 1 and 3, as
well as that in the 0.1% range for question 2. In other words, the t-test revealed sig-
nificant di
erence between information acquisition by traditional methods and our sys-
tem for all questions. Because our system scores a higher average and lower standard
deviation than traditional methods for questions ”were you able to find cross-boundary
information on your interest?”, ”did this service help in conversation and exchange of
information with other users?”, and ”would you like to continue to use this service as a
method of interest information acquisition?”, we conclude that our system is useful in
users gaining cross-boundary information on a topic, or exchanging such information.
Furthermore, the 84.2% rate of subjects choosing answers 4 or 5 for question 4 sup-
ports the validity of the method of data presentation by our system. With a spread of
3.78, answers to question 5 ”did user nodes help you find points in common with other
ff
Ta b l e 1 .
Survey questions on information acquisition through previous methods
Q1. Were you able to find cross-boundary information on your interest?
Q2. Did this service help in conversation and exchange of information with other users?
Q3. Would you like to continue to use this service as a method of interest information acquisition?
Ta b l e 2 .
Survey questions on information acquisition through our system (SONAR)
Q1. Were you able to find cross-boundary information on your interest?
Q2. Did this service help in conversation and exchange of information with other users?
Q3. Would you like to continue to use this service as a method of interest information acquisition?
Q4. Did you easy to understand the presentation of data?
Q5. Did user nodes help you find points in common with other users?
Q6. Did query nodes help you understand the relation between objects?
Fig. 9.
Mean and standard deviation of the scores in evaluation experiment
Ta b l e 3 .
Result of t-test in evaluation experiment
Q1 Q2 Q3
t-values 2.115 4.135 1.913
P-values (one-sided test) 0.0247499 0.000346 0.036372