Environmental Engineering Reference
In-Depth Information
(a)
(b)
(c)
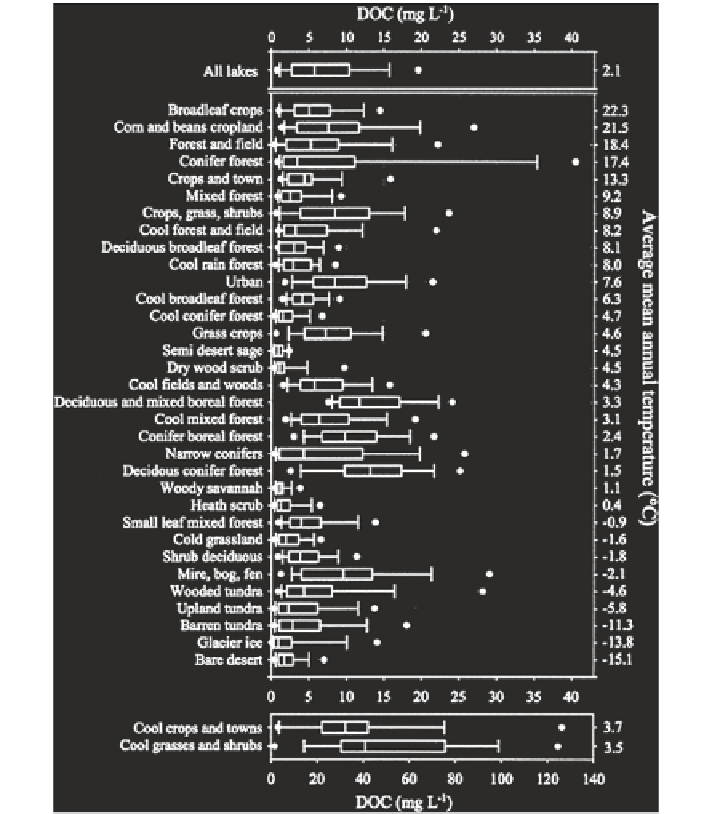
Fig. 2
Box and whisker-plot of the distribution of DOC concentration (
a
) for all lakes, (
b
) for
lakes divided into different land-cover types, and (
c
) for lakes in Saskatchewan, Canada. In (
b
),
the land-cover types have been sorted according to the average mean annual temperature. The
boxes display the median and the quartiles, the whiskers represent the 10 and 90 % percentiles,
and the points represent the 5 and 95 % percentiles. Only land-cover types containing 10 or more
lakes are shown. The land-cover types “inland water” and “sea water” are omitted from the plot
because they are not indicative of climate or geography.
Data source
Sobek et al. (
2007
)
DOM Contents in Estuaries
DOC concentrations in estuaries are often lower than in lakes all over the world.
They reach 84-473
μ
M C in China (Chen and Gardner
2004
; He et al.
2010
);
283-558
μ
M C in Brazil (Dittmar and Lara
2001
); 190-2046
μ
M C in the USA