Environmental Engineering Reference
In-Depth Information
(a)
Peak T
(b)
Peak T
UV
pH
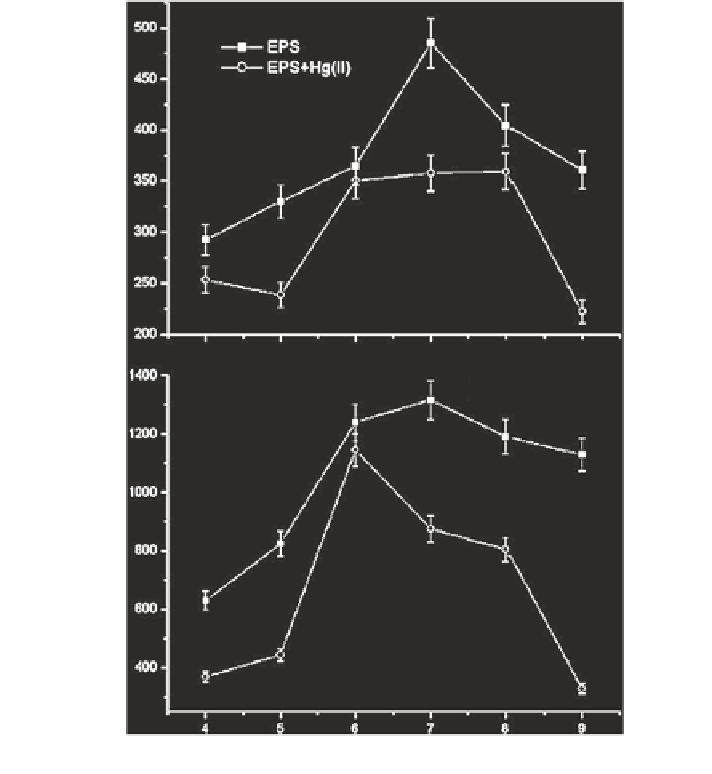
Fig. 9
Changes in the fluorescence intensities of peak T (
a
) and peak T
UV
(
b
) for extracellular
polymeric substances (EPS) with solution pH in the absence and presence of 3.0 mg L
−
1
Hg(II).
The
error bar
indicates the standard deviation of three independent measurements.
Data source
Zhang et al. (
2010
)
In case of tryptophan-like substance or extracellular polymeric substances
(EPS), the fluorescence intensities at peak T- and peak T
UV
-regions are the high-
est at neutral pH (7.0) and often decrease when the solution pH increases (9.0)
or decreases (4.0) (Fig.
9
) (Zhang et al.
2010
). The EPS is mostly composed of
tryptophan-like substances that show a twice higher fluorescence intensity at peak
T
UV
than at peak T (Fig.
9
). The pH effect on tryptophan-metal complexation has
some characteristic features. The fluorescence intensity of peak T
UV
is highest at
pH 6 and peak T is similar at pH 6-8, differently from the trend of tryptophan flu-
orescence (Fig.
9
) (Zhang et al.
2010
). The fluorescence intensities of tryptophan