Environmental Engineering Reference
In-Depth Information
Peak T
UV
+
+
NH
3
NH
3
-
-
CH
CH
Peak T
CH
2
CH
2
CO
2
CO
2
NH
NH
(o)
(p)
NH
3
+
CH
NH
2
…...
CO
2
-
CH
CO
2
H
(r)
(q)
(s)
(t)
400
365
330
Peak T
295
260
235
Peak T
UV
250 300 350 400 450 500
Em wavelength (nm)
(u)
(v)
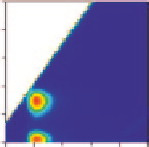
Fig. 3
Continued
(
o
) in EEM data of its aqueous samples and in river waters (Yasu River, Japan) identified using
PARAFAC modeling. PARAFAC analysis is conducted on earlier published and their respective a.u.
data (
Data source
Mostofa et al.
2005a
,
2005b
). The molecular structure of tryptophan (
q
) and its
resonance configuration (
r
). The fluorescent EEM spectra of standard tyrosine amino acid (
s
) dissolved
in Milli-Q waters (
Data source
Nakajima
2006
).
(275/
3
57 nm in Milli-Q water); at 275-280/322-336 and 220-230/328-334 nm in
tryptophan extracted from EPS; at 275-285/330-351 and 225-235/338-351 nm in
various freshwaters; at 275-290/339-360 and 230/340 nm in sewerage samples and
drain
k
ing water treatmen
t
pla
n
ts; at 280/338-368
a
nd 240/368 nm in estuaries; at
280-295/330-340 nm in bay and coastal waters; at 270-280/320-350 nm in marine
water
s; at 280/348 and <2
50/348 nm in ice samples from the Antarctic and Arctic
ocean; at 280/330-340 nm in soil; at 280/340 and 220/340 nm in compost prod-
ucts solutions; and at 270/354 nm in plant biomass, animal manure and soil (Coble
1996
; Parlanti et al.
2000
; Yamashita and Tanoue
2003a
; Mostofa et al.
2005a
,
2010
; Stedmon et al.
2003
; Stedmon and Markager
2005a
,
2005b
; Ohno and Bro
2006
; Nakajima
2006
; Baker
2005
; Zhang et al.
2010
; Provenzano et al.
2004
; Lu
and Allen
2002
; Dubnick et al.
2010
; Fellman et al.
2008
,
2009
,
2010
; Guo et al.
2010
; Yu et al.
2010
; Wu et al.
2011
; Yamashita et al.
2011
; Holbrook et al.
2006
;