Geography Reference
In-Depth Information
2002; Templeton 2004). This knowledge can offer insight into when recent
cenocrons incorporated to a biotic component.
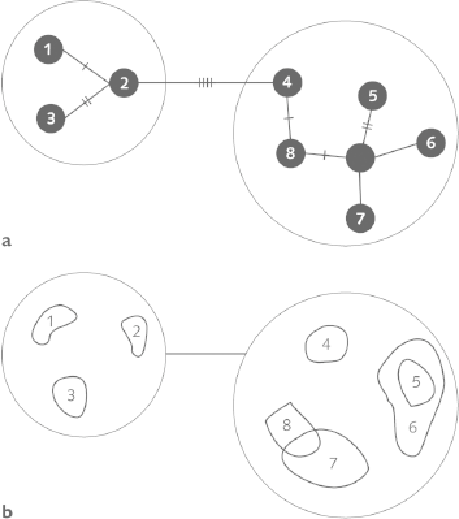
The results of a phylogeographic analysis are usually represented as a
number of restriction site differences indicates the relative distance between
haplotypes and groups of haplotypes. When mapped (
fig. 7.2b
), disjunctions
and sympatry between the haplotypes may give us clues on their evolution-
ary histories. Highly divergent groups inhabiting disjunct areas can indicate
independent evolutionary histories for a long period of time, usually due to
vicariance, whereas lack of geographic structure may indicate recent dis-
persal.
Figure 7.2
Representation of a phylogeographic hypothesis. (a) Parsimony net-
work connecting the haplotypes, where the dashes indicate restriction site differen-
ces between haplotypes and groups of haplotypes; (b) geographic distribution of the
haplotypes.