Environmental Engineering Reference
In-Depth Information
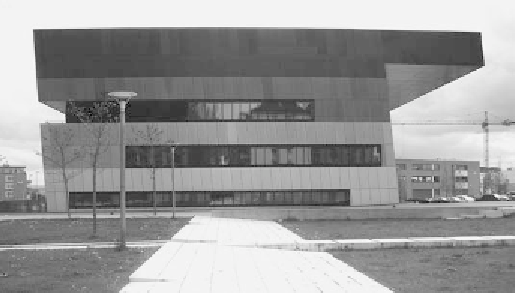
Figure 6.29
Town Hall, Ostfildern, as an example project for online simulation
biomass cogeneration. In the project a communal energy management system is im-
plemented. For the energy management, simulation tools for the supply side (cogen-
eration unit, absorption cooling systems) and the demand side (buildings) and the
necessary communication structures and interfaces to different types of BMS have
been developed.
As the first implementation project the Town Hall of Ostfildern, located within
Scharnhauser Park, was chosen (see Figure 6.29). This low-energy standard building
was completed in 2003 and is connected to the district heating system fed by the
biomass cogeneration unit and is mostly naturally ventilated without active cooling
devices.
The building has a total net volume of 14 437m
3
, of which 3724m
3
is heated to
a temperature setpoint of 20
◦
C (at a used net area of 1027m
2
); 7713m
3
net volume
and a surface area of 2250m
2
are kept at a lower temperature of 15
◦
C. There is also
an unheated cellar space of 3000m
3
volume and 818m
2
surface area. The
U
-values
of the walls are between 0.23 and 0.26Wm
−
2
K
−
1
and the windows have
U
-values
of 1.1Wm
−
2
K
−
1
and a
g
-value of 0.6 with a total window fraction of 20%. The
surface-related heat capacity is 90Whm
−
2
K
−
1
.
During the first operating year of 2004 the heating energy consumption of the
building was read manually from the installed energy meters and documented every
month. A model according to DIN EN 832 was used to calculate the energy demand
of the building for the same time period under consideration using real weather data in
monthly mean values. The results show that the calculated energy demand exceeds the
measured data significantly in the winter months (December, January and February) if
a constant air exchange rate of 0.7 h
−
1
is used in themodel. However, if the air exchange
rate is reduced to a value of 0.4 h
−
1
the calculated energy demand fits quite well for
the winter months but falls below the measured values in autumn and spring (see Fig-
ure 6.30). The calculations with reduced air exchange were done with the newGerman
prestandard DIN V 18599, which essentially uses the same algorithms as the monthly

Search WWH ::

Custom Search