Environmental Engineering Reference
In-Depth Information
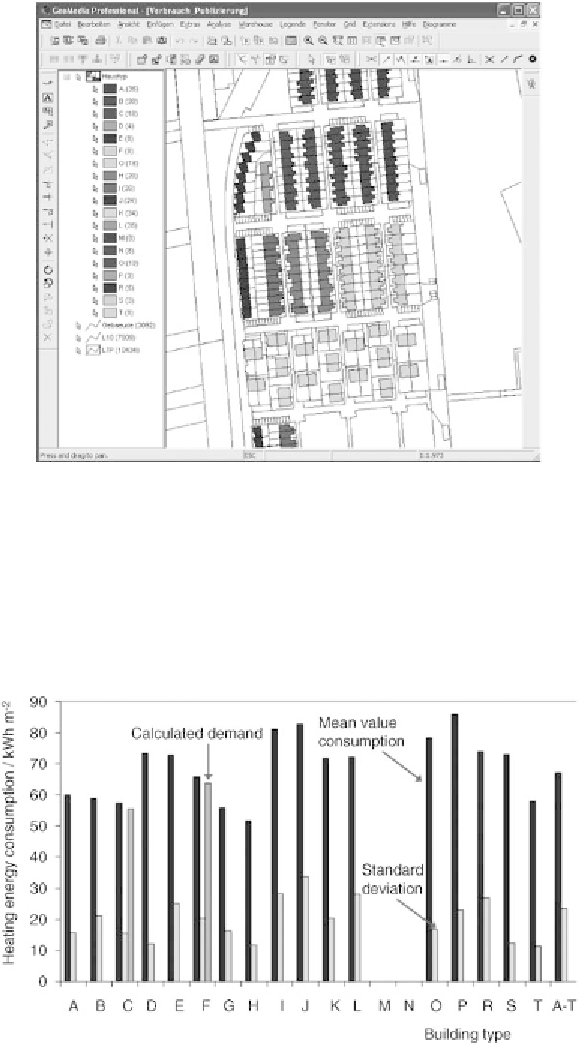
Figure 1.2
Rows of houses analysed in the POLYCITY project, visualized in a geoinformation system
consumption values of around 70 kWh m
−
2
a
−
1
.
Several hundred houses in rows con-
structed after the year 2000 in the town of Ostfildern were measured within the
European POLYCITY demonstration project (see Figure 1.2). The consumption varies
strongly even for the same building type and standard deviations are about 35% of the
mean value (Figure 1.3). The distributions for two years of measurement are shown
in Figure 1.4.
Figure 1.3
Mean measured heating energy consumption and standard deviation of different, newly
built rows of houses in Ostfildern, Germany
Search WWH ::

Custom Search