Information Technology Reference
In-Depth Information
the increase of overhead produced by nodes interactions, the time used to write
output files to hard disk, and their uploading time into the shared storage system.
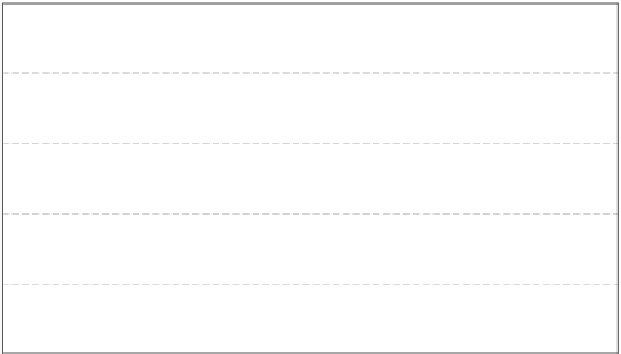
10000
base
sisim
sisim-gfs
8000
One
workstation
Multiple
workstations
6000
4000
2000
1
2
3
4
8
12
16
24
32
Available resources [cores]
Fig. 5.
Time comparison of
sisim
and
sisim-gfs
with available resources
4.3
Improved SISIM Scalability Test
To avoid the bottleneck generated by multiple processes writing result files to
hard disk and the overhead of uploading those files to the shared storage system,
we use the C API to make a simple wrapper from Fortran, allowing us to write
each simulation result directly to GridFS. Doing a simple modification to the
sisim
code, we replaced line 8 on the Algorithm 9 by our own
write to gfs
function which saves the final
V
tmp
array directly to the shared storage system.
We perform the same tests detailed in section 4.2 and the results can be
viewed in Table 2. Furthermore, Figures 5 and 6 show a comparison between
standard
sisim
and improved
sisim-gfs
tests.
Speedup results are based on standard
sisim
single core execution time. Both,
single node and distributed tests results show a clear overall computation time re-
duction. The
sisim-gfs
results shows a reduction on overhead by using GridFS.
Figures 5 and 6 shows that
sisim-gfs
perform better than the standard
sisim
and when using more workstations, the former tend to outperform twice the
standard.
4.4 Heterogeneous Cluster Distribution Test
Finally, in order to run a larger test using all computational resources available
in our laboratory, a cluster of eleven heterogeneous nodes with a total of 46
cores was used, as specified in section 4.1. Initially was needed close to 2 hours
32 minutes to run 96 simulations in a single thread execution (base case, Tables