Information Technology Reference
In-Depth Information
The graphics in Fig. 6 and Fig. 7 show that the parallel yaw angle estimation
is an accurate implementation of the sequential version.
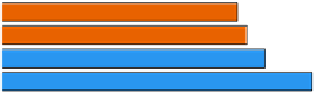
Figure 8 shows the parallel and serial execution times to process two con-
secutive frames of the sFly data set, for different combinations of nodes and
threads. The analysis of results for the unbalanced configurations (i.e., orange
and lilac for Master/Slaves and Master/Taskmasters/Slaves, respectively) allows
concluding the configuration that use taskmasters outperform in 2
those that
not use them. A good example of this behavior is the comparison between the
different configurations of 2N8T and the different configurations of 3N24T. In
the last case, given that it is an heterogeneous configuration, the best result
is performed with a balance method, but keeping this configuration apart and
taking only the unbalanced, again approximately an increase 2
×
of performance
is achieved. Obviously, for heterogeneous configurations (i.e., all configurations
with three nodes together with the configuration of two nodes and twenty threads
(2N20T)) a better performance can be achieved using load balancing.
×
3N16T
0.0655
0.0656
0.0695
0.0697
Master/Slaves
3N20T
Unbalanced
3N12T
Master/Slaves
Balanced
2N20T
Taskmasters
2N8T
2N8T
0.0706
Unbalanced
0.0707
0.0783
Taskmasters
Balanced
3N24T
2N8T
0.0948
Without
Parallelization
2N20T
0.0949
0.0980
1N4T
3N20T
0.1055
1N4T
0.1060
3N24T
0.1099
0.1202
3N16T
2N20T
0.1229
3N24T
0.1329
3N12T
0.1335
2N8T
0.1574
3N20T
0.2120
0.2127
0.2237
3N16T
3N12T
0.2270
2N20T
3N24T
0.2366
Sequential
1N1T
0.2541
0.2993
0.00
0.05
0.10
0.15
0.20
0.25
0.30
0.35
Time [s]
Fig. 8.
Execution times to process two consecutive frames of each implemented con-
figuration using the sFly data set