Information Technology Reference
In-Depth Information
Empirical
Least squares
Worst cases
Empirical
Least squares
Worst cases
55
100
50
90
45
40
80
35
30
70
25
60
20
15
50
10
1 2 3 4 5 6 7 8 9 10 11 12 13 14 15 16 17 18 19 20 21 22 23 24
1 2 3 4 5 6 7 8 9 10 11 12 13 14 15 16 17 18 19 20 21 22 23 24
#CPU
#CPU
Empirical
Least squares
Worst cases
300
35
280
260
30
240
220
25
200
180
20
160
140
120
15
1 2 3 4 5 6 7 8 9 10 11 12 13 14 15 16 17 18 19 20 21 22 23
0
5000
10000
15000
20000
25000
#CPU
t(s)
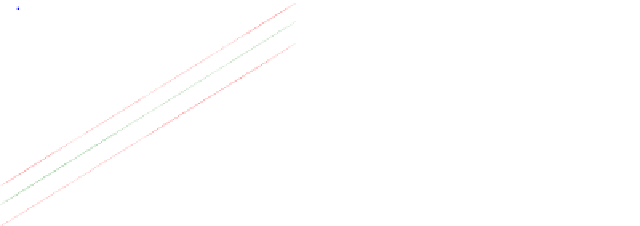
Fig. 2.
Energy consumption for the three applications in the test (loop, LINPACK,
and FFT, respectively), and instant power usage sample (loop test case)
Table 1 reports the maximum (worst case) and mean values for the error and
the deviation from linearity in the energy consumption, along with the relative
error values for each application in the test suite.
Table 1.
Error results and deviation from linearity for the three tests performed
error
deviation from linearity
relative error
test
maximum mean maximum
mean maximum (%) mean (%)
simple loop
5.71 2.56
2.48
1.11
7.36
3.34
LINPACK
5.36 2.39
2.74
1.23
21.58
7.98
FFT
3.52 1.26
2.82
1.01
13.11
4.88
The numerical results validates the linear increasing energy consumption
model, as we verify that the deviation from linearity when using real appli-
cations is below 3%; and the relative error on the energy consumption is below
8%, and about 5% in average. These results demonstrate that no significant im-
pact is observed when executing CPU-oriented applications, such as the ones
commonly executed in HPC facilities. Taking into account the results of the
empirical analysis, we assume that the energy consumption error for multicore
computers is in the range [-5%,5%].