Information Technology Reference
In-Depth Information
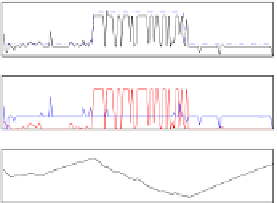
shows that the power closely follows the step-changing reference power, enabling
the datacenter to reduce electricity costs, maximize renewable utilization, or
participate in the electricity market. For example, if the electricity price was to
change from 0.4 $/kWh during peak time to 0.23 $/kWh during off-peak time
(the case for some electricity retailers in Australia) the solution in Fig. 4(a)
would reduce the energy cost in the electricity bill of the datacenter by
16.5%
.
4000
4000
actual power
reference power
actual power
reference power
2000
2000
0
0
0
50
100
150
0
50
100
150
time
time
3000
3000
cooling power
server power
cooling power
server power
2000
2000
1000
1000
0
0
0
50
100
150
0
50
100
150
time
time
28
27
actual temperature
reference temperature
actual temperature
reference temperature
26.5
26
26
25.5
24
0
50
100
150
0
50
100
150
time
time
(a) Best power solution
(b) Best temperature solution
4000
4000
actual power
reference power
actual power
reference power
2000
2000
0
0
0
50
100
150
0
50
100
150
time
time
3000
cooling power
server power
cooling power
server power
2000
2000
1000
1000
0
0
0
50
100
150
0
50
100
150
time
time
27
28
actual temperature
reference temperature
26
26
actual temperature
reference temperature
25
24
0
50
100
150
0
50
100
150
time
time
(d) Selected trade-off solution
Fig. 4.
Best and trade-off NSGA-II+EFT solutions (75 tasks, profile A)
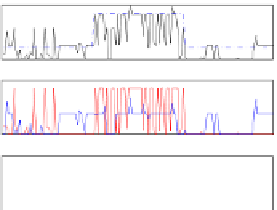
(c) Best QoS solution
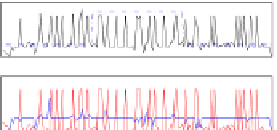
Fig. 4(b), which gives maximum priority to temperature, shows a tight regu-
lation within less than 0.5 C from the reference. It is 81% better than the BAU
solution with respect to temperature. However, it being an extreme of the Pareto
front, we observe poor power tracking for this solution. Fig. 4(c) shows the best
solution in terms of QoS (zero violated deadlines). Finally, Fig. 4(b) presents
the selected trade-off solution from the Pareto front which is closest to the ideal
vector. While, as expected, this solution does not follow the reference power
or temperature as closely as Fig.s 4(a) and 4(b) respectively, it roughly tracks
power while maintaining the temperature deviation from the reference at less
than 1 C at all times except for a 1.2 C excursion at the end of the simulation.
6 Conclusions and Future Work
This article presented a multiobjective optimization approach for operating a dat-
acenter taking into account power profiles, temperature and QoS. The proposed