Information Technology Reference
In-Depth Information
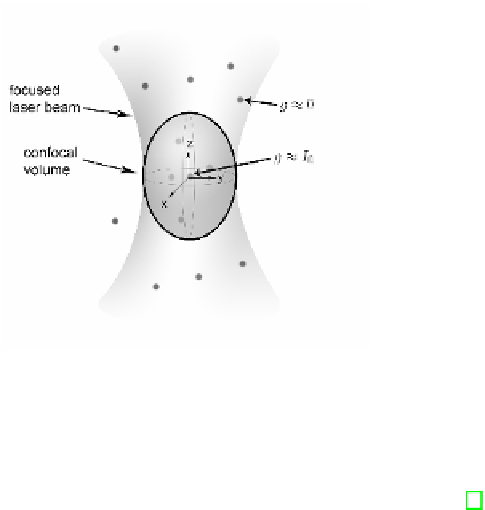
Fig. 1.
Fluorescent molecules diffuse through the small observation volume. The prob-
ability of emitting a photon depends on the relative position of the molecule respect
to the center of the observation volume.
FCS has been applied to study diffusion, transport, binding, etc. [7]. In the
case of simple scenarios such as molecules passively moving in a homogeneous
media, the FCS analysis yields analytical functions that can be fitted to the ex-
perimental data to recover the phenomenological rate parameters (e.g. diffusion
coecients, chemical rate constants, etc.). However, many dynamical processes
in cells do not follow these simple models and, in many instances, it is not pos-
sible to obtain an analytical function through the theoretical analysis of a more
complex model [7].
In those cases, the experimental analysis can be combined with Monte Carlo
simulations to help with the interpretation of the experimental data recovered
in FCS experiments (see for example, [6]). The comparison between the expec-
tations for a reduced, simulated model and the experimental data could provide
important clues of the dynamical processes hidden in the FCS data. Despite
of being useful, most Monte Carlo tools used to simulate FCS experiments are
developed as sequential ad-hoc programs designed only for specific scenarios.
The procedure for FCS measurements is presented in Fig. 2: (a) shows a car-
toon of the experimental setup required in these experiments. The sample (e.g.
cells expressing a fluorescent protein) is placed on top of the microscope stage of
a confocal or two-photon excitation microscope. The excitation laser is focused
in a diffraction-limited spot on the sample and fluorescence photons produced in
the small observation volume (near 1 fl.) as presented in (b); (c) shows a repre-
sentative fluorescence intensity trace obtained in an FCS experiment. This trace
shows fluctuations due to fluorescent molecules moving in and out of the ob-
servation volume. The amplitude of the fluctuations are inversely related to the
number of molecules in the observation volume while their duration is given by
the dynamics of these molecules. This information can be recovered calculating
the autocorrelation function, such as the example presented in (d).


