Agriculture Reference
In-Depth Information
Recording dough mixers
A recording dough mixer (RDM) is truly the
workhorse of wheat science and technology and
provides the basis of a variety of standard methods
(e.g., AACC approved methods 54-21, 54-40A,
and 54-50, AACC 2000). The importance of
RDMs becomes more apparent when considering
that subsequent testing of developed doughs
requires a known and repeatable processing
history. This is most easily achieved with a RDM.
There are a number of RDMs in common use but
importantly they share elements of data output
and so the general features of RDMs can be
addressed as a whole rather than mixer by mixer.
This is despite the circumstance that the various
RDMs possess different mixing geometries (e.g.,
z-arm versus planetary pin), different minutiae
related to operation, differences in the precise
nature of their outputs, and limitations that are
unique to each type.
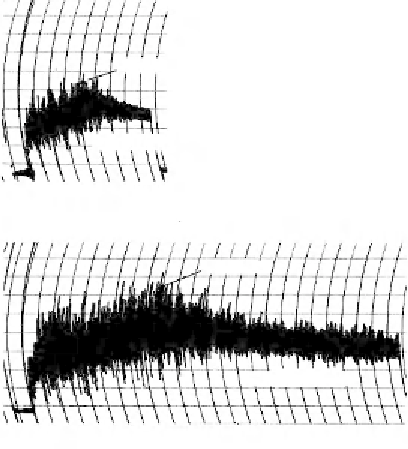
Using a mixograph (National Mfg. Co.,
Lincoln, Nebraska) trace as the archetype one can
observe the common elements (Fig. 20.4). Data
output can be analogue and read manually, but
most RDMs have the capacity to give electronic
outputs where the major descriptors of the mixing
curves are available through machine analyses. An
alternative method of assessing mixograms is by
visually scoring the overall shape of the mixogram
curve to provide a mixing tolerance score based
on comparison with a set of reference mixogram
curves (e.g., Baenziger et al., 2001).
The RDM curve can be partitioned into two
major portions: (i) a rising portion of the curve
prior to the peak where the fl our is hydrating and
dough development is occurring; (ii) a descending
portion where the developed dough breaks down
to a greater or lesser extent as a result of contin-
ued mixing (overmixing). Differences in the time
of arrival at peak development are indicative of
differences in mixing times that in a broad sense
are refl ected in mix times in commercial produc-
tion; elements of scale, geometry, and mixing
intensity change from mixer to mixer and these
aspects will dictate optimum mixing time in a
specifi c mixer.
For a given mixer faster arrival at peak dough
development can indicate faster hydration.
Hydration speed can affect mix times in both z-
arm and pin mixers. For example, Sapirstein et
al. (2007) showed that reducing the particle size
in a mix of durum semolina and fl our (by infer-
ence, increasing surface area to volume ratio of
the particles and therefore increasing hydration
rate) shortened development time in both the
farinograph and mixograph. Faster arrival at
peak dough development in a general sense can
also be related to weaker dough characteristics,
as short mix times are often but not always asso-
ciated with lower tolerances to overmixing. The
mixers themselves vary in mixing intensity and a
planetary pin-mixer like the mixograph has a
higher rate of energy input (more intense mixing
characteristics) than the available z-arm (e.g.,
farinograph) or blade mixers when these are run
at standard speeds. For example, it is known that
the amount of SDS-insoluble glutenin decreases
as mixing continues to peak development (Don
et al., 2003). Following from that Surel et al.
(2006) compared three RDMs and showed that
Peak Time
Mixing Tolerance
Weak Gluten Flour
Peak Time
Mixing Tolerance
Strong Gluten Flour
Fig. 20.4
Mixograms of typical weak (upper panel) and
strong (lower panel) doughs. [
Source
: Wheat Marketing
Center (2004).]