Agriculture Reference
In-Depth Information
the instruments most commonly used for paste
viscosity analysis of starch and fl our in wheat
technology applications in the current era. A
number of swelling power tests is available. The
one in most common use in wheat applications is
the fl our swelling volume (FSV) test (Crosbie et
al., 1992; AACC approved method 56-21, AACC
2000).
The principles of operation for both of the
paste viscosity instruments are similar. A starch
or fl our slurry is cooked under controlled condi-
tions, and either the resistance to the movement
of a rotating sensor (RVA) or the pressure against
a stationary sensor from a rotating sample and
container (VAG) is detected mechanically (VAG
only) or electronically (RVA, VAG-E, Micro-
VAG). Outputs from both instruments are
plots of apparent viscosity vs. time, and there are
numerous variants of solids concentrations, rota-
tional speeds, and heating and cooling rates that
can be applied for specifi c purposes. Applications
of the RVA (Crosbie and Ross 2007) and VAG
(Rasper 1980) have been reviewed elsewhere.
The swelling power and FSV tests gelatinize
starch or fl our in excess water in a closed tube.
The starch swells under minimal shear in com-
parison with the paste viscosity measurements,
since only mild inversion is applied after the
starch-fl our suspension has swollen enough to
prevent sedimentation. Volume, or height (as
a proxy for volume), is recorded after centri-
fugation. Weight can also be recorded and
the proportional increase in gel weight with
respect to the dry sample weight has been
reported as water-holding capacity (Wang and
Seib 1996).
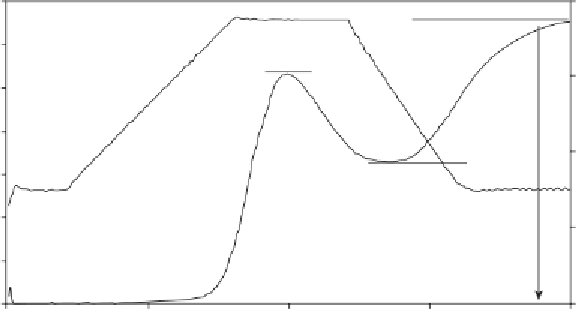
Operating under standard conditions (for RVA,
AACC approved method 76-21, AACC 2000; for
VAG, Rasper 1980), the pasting curves from the
RVA and VAG have several common elements
that are useful in determining the processing
potential of a fl our or starch sample (Fig. 20.3).
In principle the curve shapes are similar. However,
there are inherent differences between instru-
ments and occasional apparent disagreements in
results. These differences are often considered to
be related to differences in heating rates. However,
even when the RVA temperature profi le was
matched to the VAG heating and cooling rate of
1.5 ºC min
−1
and to the same hold times at 50 and
95 ºC, differences in pasting curves were still
evident and appear to be related to mixing geom-
etry, apparent shear rates, and differences in
solids concentrations (Deffenbaugh and Walker
1989). The apparent shear rate in the RVA has
been calculated as 54 s
−1
at 160 rpm (Booth and
Bason 2007). The slower rotational speed (75 rpm)
and the dissimilar mixing geometry of the VAG
intuitively suggest lower shear rates (Deffenbaugh
and Walker 1989), but the mixing geometry of the
VAG is considered too complex to calculate shear
rates in the complex fl ow fi eld (Lagarrigue and
Alvarez 2001). These types of differences make
comparisons among the RVA, VAG, and any
Setback
Temperature
profile
Final
viscosity
Pasting
temperature
Peak
viscosity
Viscosity
profile
Holding
strength
Fig. 20.3
Typical RVA curve
showing the basic descriptors
used to characterize the curve
attributes.
[
Source
:
Batey
Time
(2007).]