Agriculture Reference
In-Depth Information
can Association of Cereal Chemists developed
numerous standardized methods for evaluating
fl our in a food product (AACC 2000). Millers
must understand the product for which a particu-
lar fl our type will be used and evaluate wheat
choices based on tests that best represent that
product.
mm
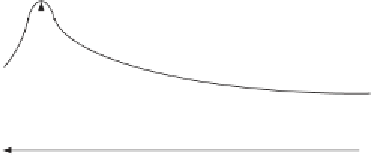
“W” Value = Area Under Curve
mm
L value
Fig. 19.4
The
P
value from an alveograph curve represents
the force required to blow a bubble from the dough, whereas
the
L
value is the extensibility of the dough before breaking.
The
W
value incorporates both
P
and
L
and is considered an
overall indicator of dough strength.
CANADIAN SYSTEM OF CLASSIFICATION
AND MARKETING
The Canadian Grain Commission (CGC) sets
Canadian wheat standards and classifi cations in
consultation with industry; however, the wheat
classifi cation approach in Canada is much more
restrictive than in the US. In particular, Western
Canada wheat cultivars must meet a visual
appearance standard referred to as kernel visual
distinguishability (KVD). The KVD standard
ensures that wheat classes are readily identifi able
throughout the handling system, and it has main-
tained kernel size and shape relatively uniform
within a class over time. Eastern Canada wheat
is not under the control of the Canadian Wheat
Board for marketing, so KVD is not required for
most eastern Canadian classes; Canada eastern
white winter is the exception. The KVD stan-
dard is well established and has demonstrated
benefi ts, but it has been criticized for limiting
cultivar development to meet niche markets and
for using visual criteria that are somewhat
subjective.
Two of the eight Western Canada classes con-
stitute the majority of Canada's wheat exports.
The largest class, often 15.0 million tonnes pro-
duced per year, is Canada western red spring
(CWRS). The second largest class, at nearly 5.0
million tonnes of production per year, is Canada
western amber durum. The remaining classes—
Canada western extra strong (CWES), Canada
western red winter (CWRW), Canada prairie
spring red (CPSR), Canada prairie spring white
(CPSW), and Canada western soft white spring
(CWSWS)—are considered minor because of
their small infl uence on export markets.
Through the CGC, Canada also takes a differ-
ent approach to grading wheat within a class,
fermentation time or an additive on dough per-
formance. Extensograph results also can be helpful
in understanding how dough will perform in
sheeted products such as pizza skins.
The alveograph is similar to the extensograph;
however, it measures dough by mimicking the gas
pressure created by yeast during fermentation.
The force required to infl ate and burst a bubble of
dough is graphed, and doughs with varying elastic
strengths may be compared (Fig. 19.4). Dough
that can be infl ated to a very large bubble without
breaking has high elasticity and is suitable for
yeast-levened bread products. Millers and bakers
use results of the alevograph test to ensure consis-
tency. The alveograph is especially well suited for
evaluating wheat with medium to weak dough
strength, such as that intended for use in cakes,
cookies, or other confectionery products.
Product performance
Although many chemical and functionality tests
are available to measure dough quality, fi nished
product performance is the only true measure
of the performance quality of wheat. Evaluating
wheat quality using a standardized fi nished
product methodology attempts to eliminate all
variables except those that exist within the wheat
and wheat fl our, and such an evaluation requires
a diversity of tests as varied as the fi nished prod-
ucts. Essentially, there are as many ways to evalu-
ate wheat as there are types of bread. Some groups
have attempted to create standardized bake tests
to establish a common language for and under-
standing of fi nished product quality. The Ameri-